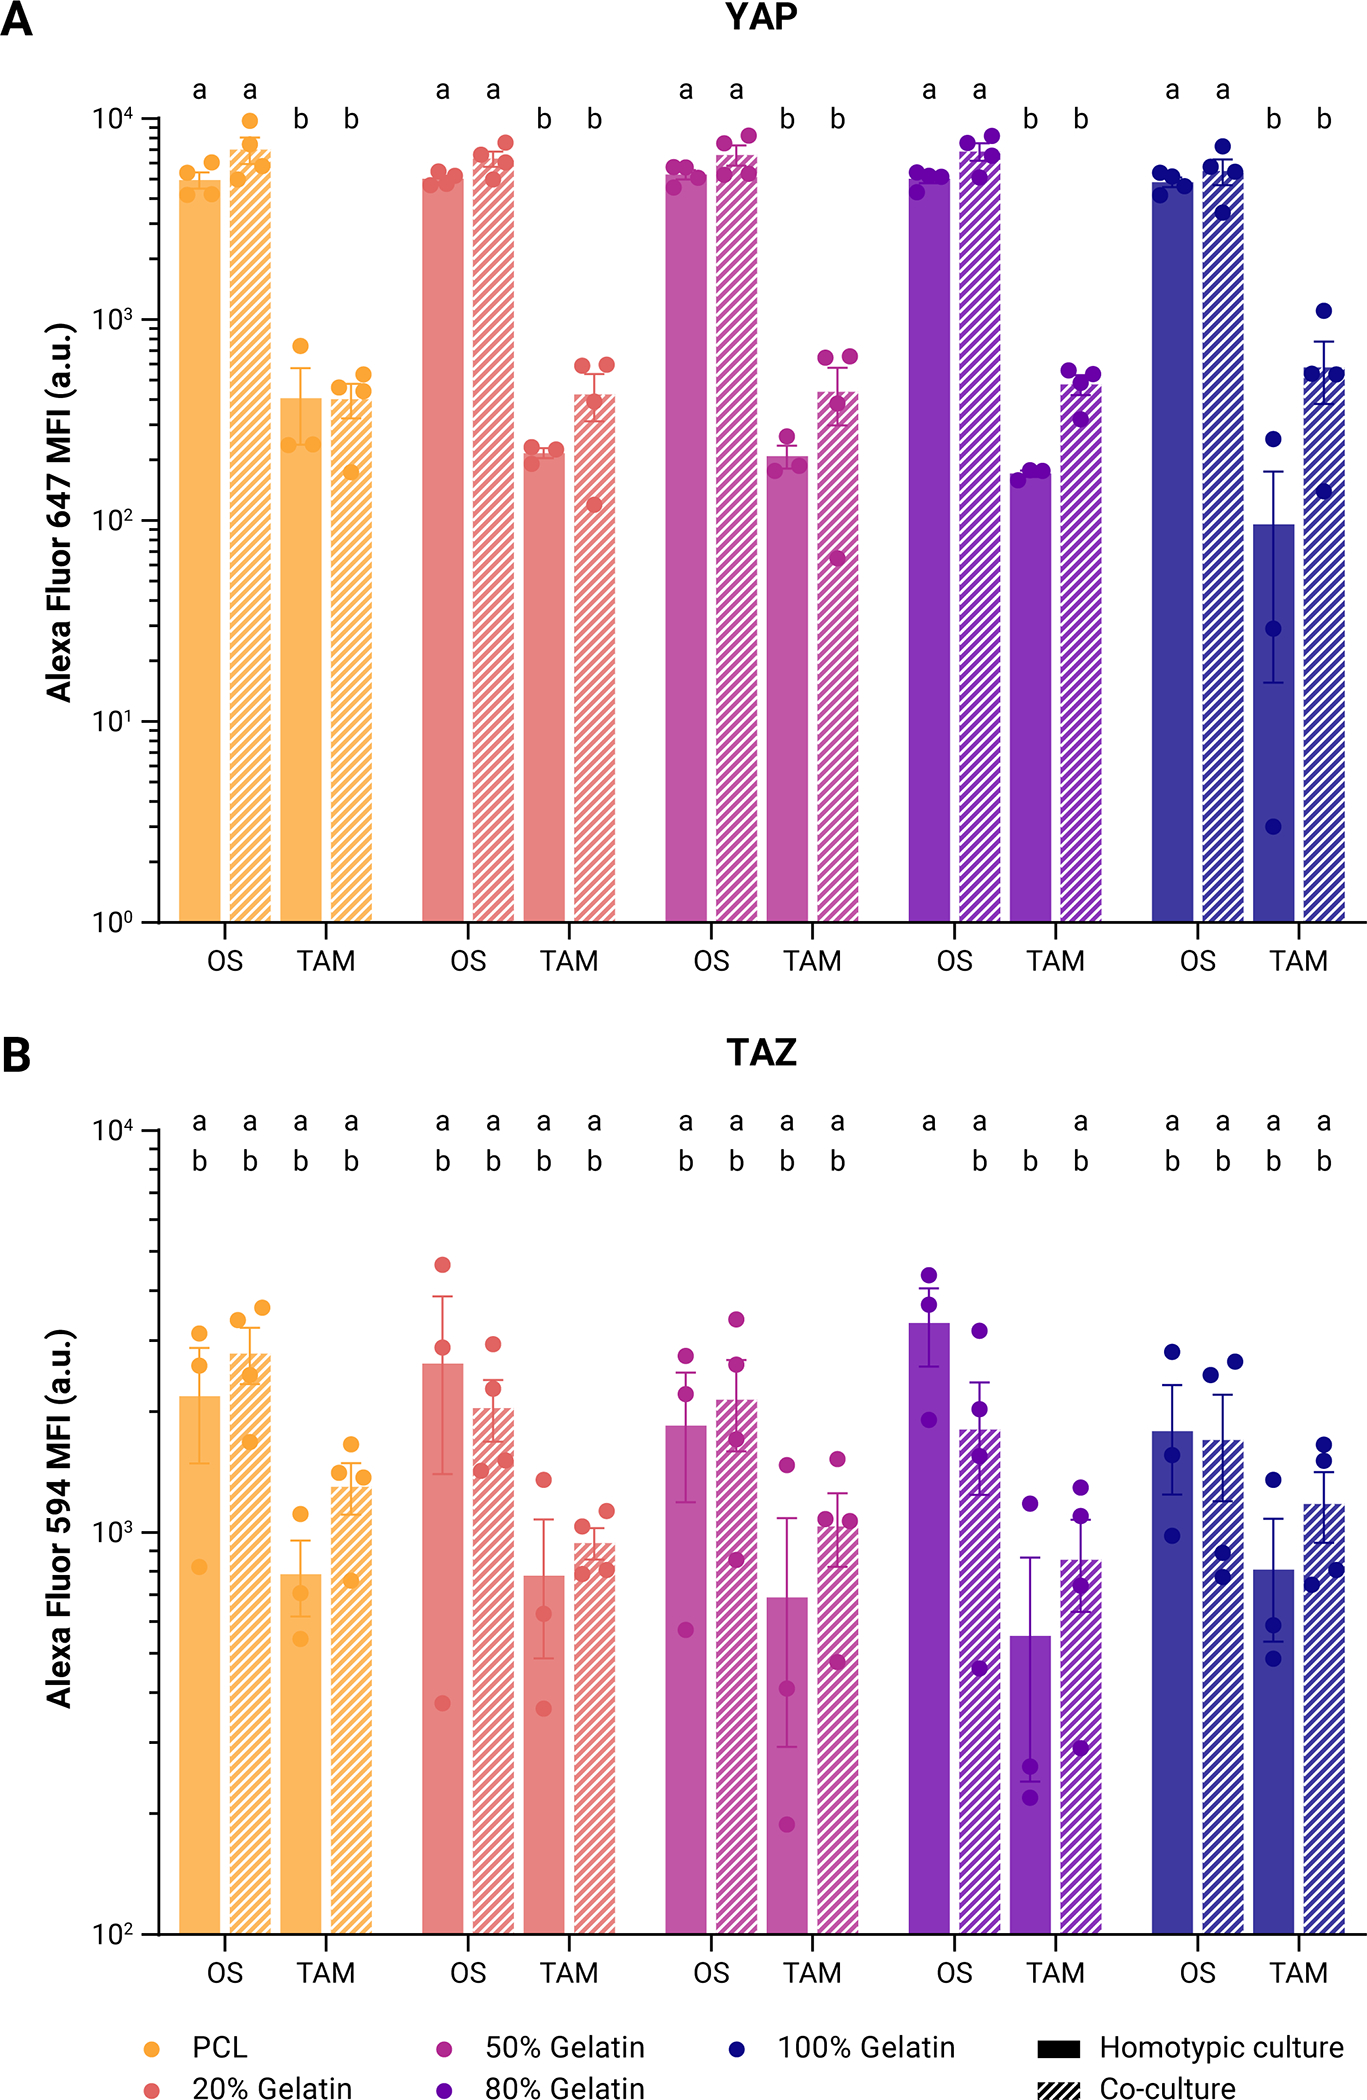
Figure 4: Comparison of Hippo pathway effector expression in OS/TAM cultures.

Expression of (A) YAP as measured by mean fluorescence of Alexa Fluor 647 and (B) TAZ as measured by mean fluorescence of Alexa Fluor 594 in OS cells and TAMs in homotypic culture or co-culture. Points represent individual measurements of the geometric mean. Bars represent mean ± SE. Two-way ANOVA with post-hoc Tukey’s HSD, p < 0.05. Groups that do not share the same letter are statistically different.
