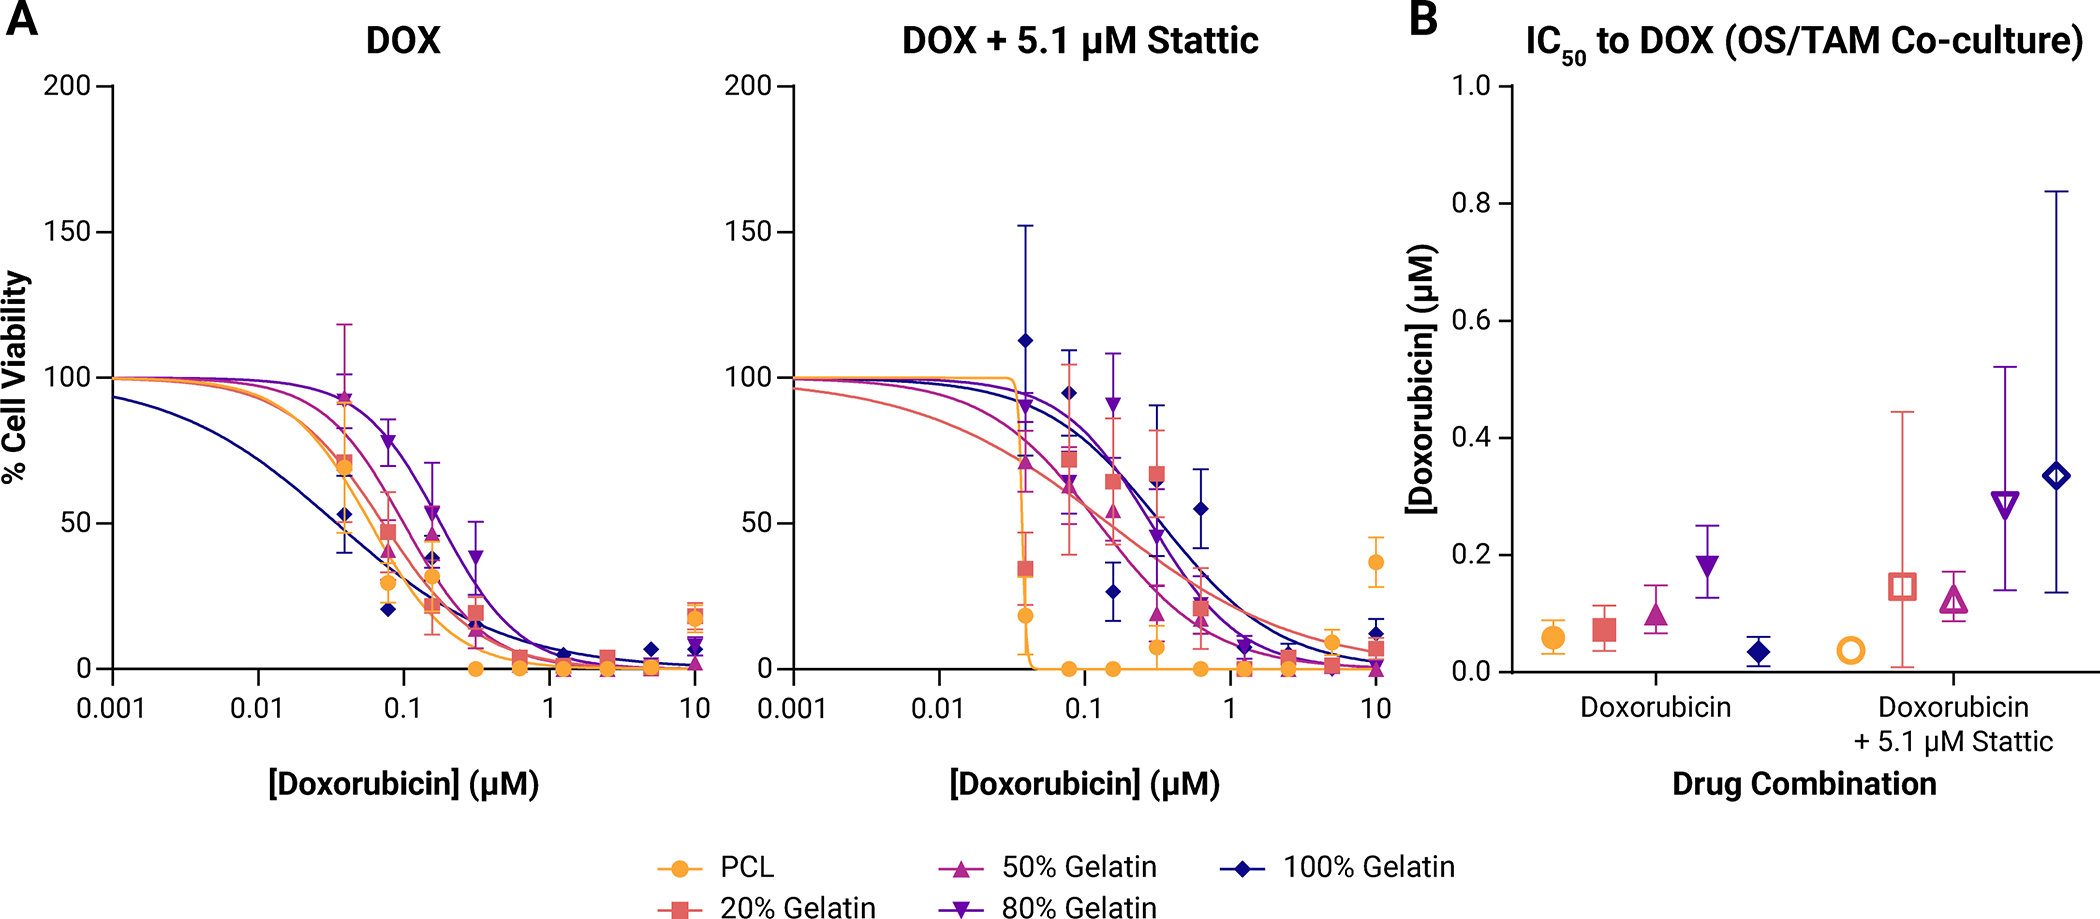
Figure 5: Drug response in OS/TAM co-cultures.

(A) Dose-response curves to doxorubicin (DOX; left) or doxorubicin with 5.1 μM Stattic (right) in OS/TAM co-cultures. Points shown represent mean ± SD (n = 4 for each drug concentration for each scaffold). (B) Calculated IC50 (points) with 95% confidence interval (95% CI; bars) to doxorubicin. Doxorubicin only treatment is shown in filled points. Combination treatment of doxorubicin with 5.1 μM Stattic is shown in open points.
