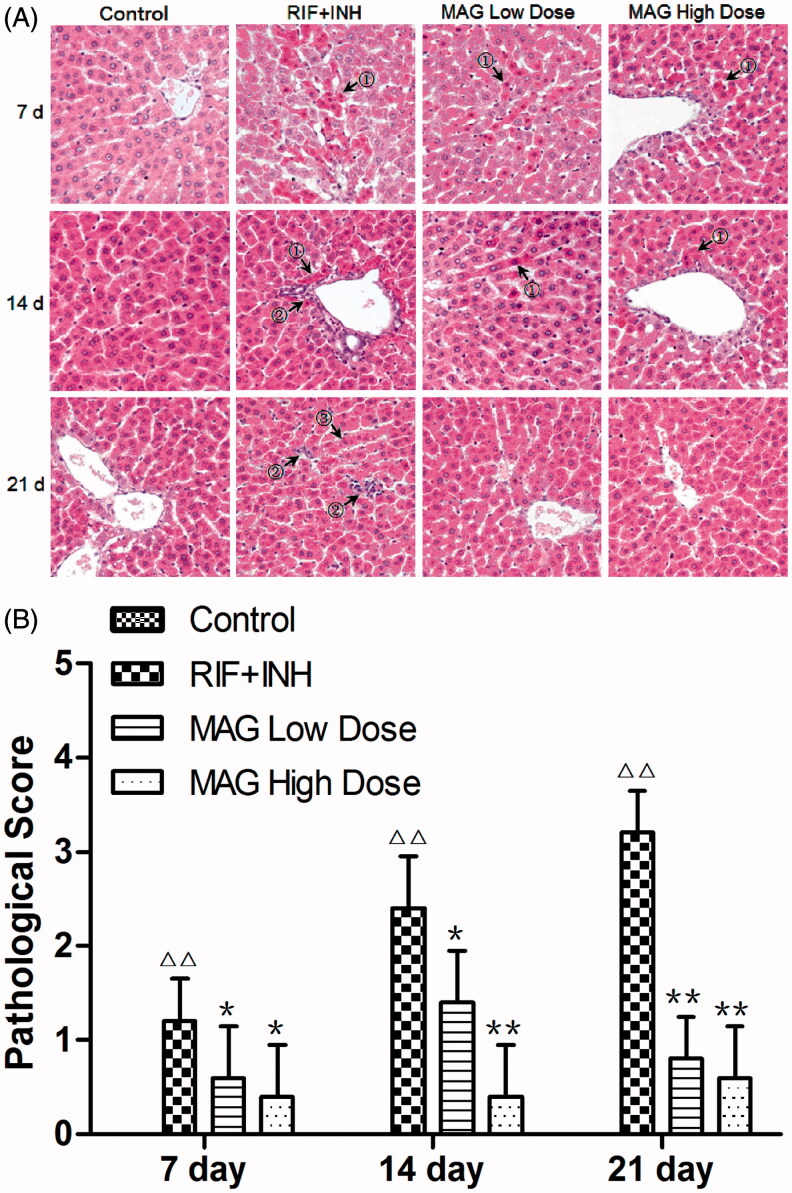
Figure 2.
Histopathology changes of control, RIF + INH, MAG low-dose, and MAG high-dose groups after treated for 7, 14, and 21 d. (A) Photomicrography of liver sections; (B) statistical analysis of HAI (histological activity index) scores. ① acidophilic and pyknosis ② inflammation and necrosis ③ fatty degeneration. Images of all groups were taken at ×200 magnification. Data are shown as mean ± SD. Each group at each time point contained five rats. Δp < 0.05 versus the control group; ΔΔp < 0.01 versus the control group; *p < 0.05 versus the RIF + INH group; **p < 0.01 versus the RIF + INH group.

