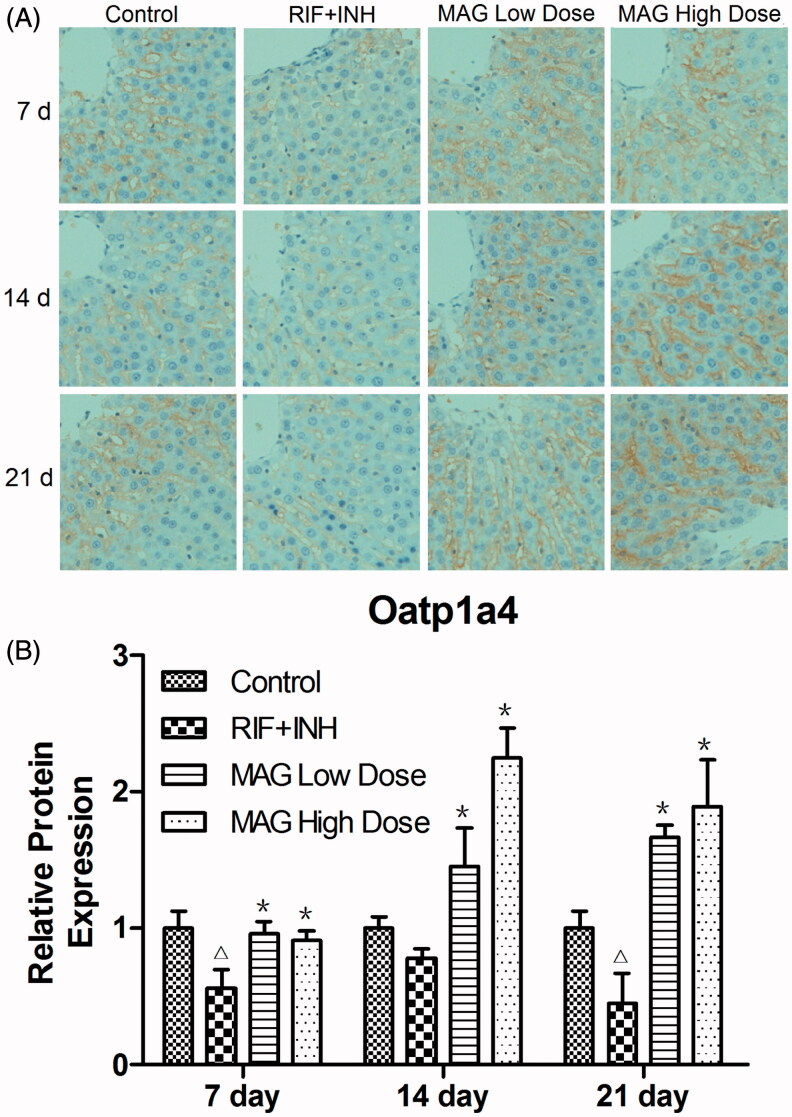
Figure 5.
Immunohistochemical images and statistical results of Oatp1a4 in liver tissue from rats of the control, RIF + INH, MAG low-dose, and MAG high-dose groups. The data were presented as representative pictures (A) and as mean relative Oatp1a4 protein expression ± SD (B). Each group at each time point contained at least 15 immunohistochemistry images. Δp < 0.05 versus the control group; ΔΔp < 0.01 versus the control group; *p < 0.05 versus the RIF + INH group; **p < 0.01 versus the RIF + INH group.

