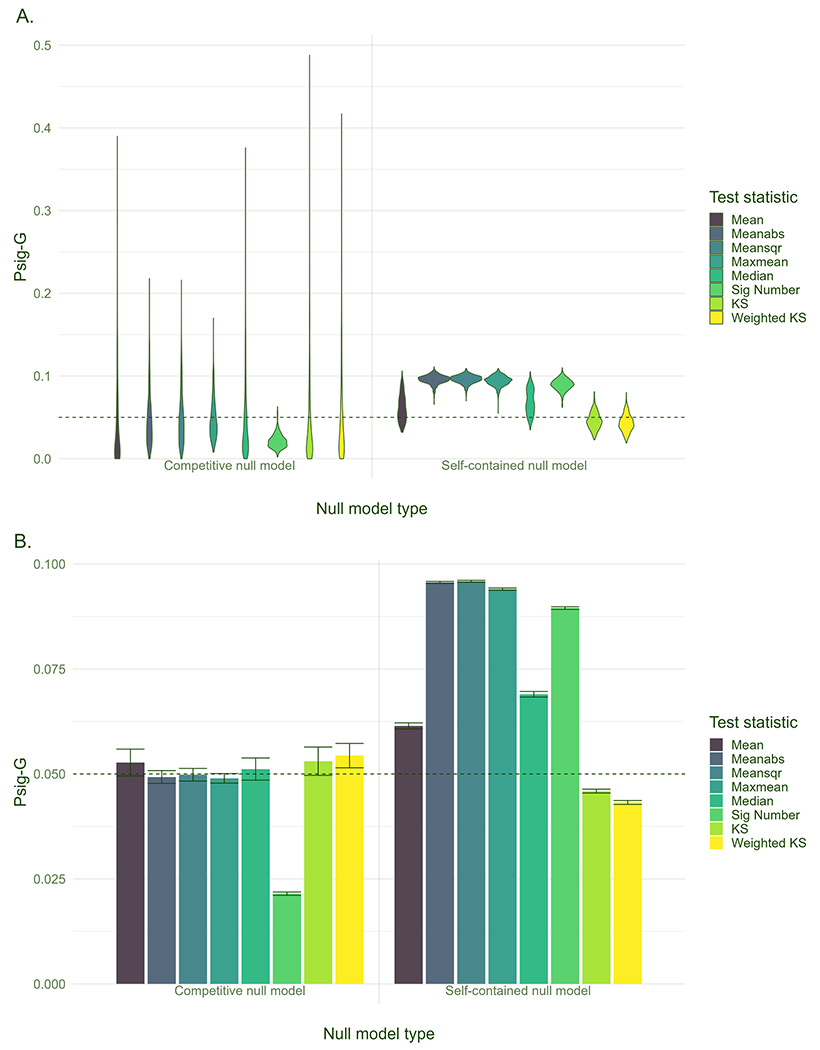
Fig. 3.

A. Probability of significance for each gene set (Psig-G). B. Mean value and standard error (i.e., standard deviation/) of Psig-G across all the gene sets. The tests are carried out at a nominal α = 0.05 significance level and the horizontal dashed line denotes a Psig-G of 0.05.
