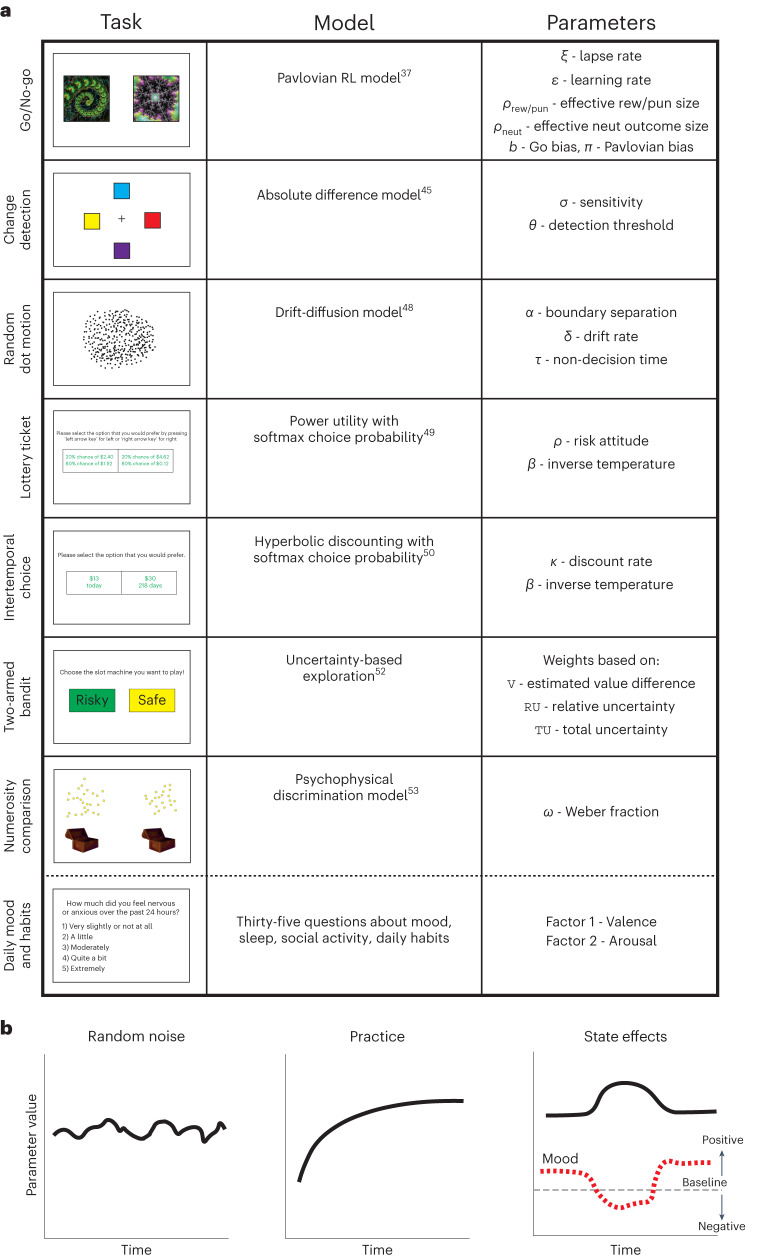
Fig. 1. Experimental tasks and models.
a, Participants performed 7 cognitive tasks and a survey on a weekly basis for 12 consecutive weeks. The left column shows an example screen from each task. The middle column shows the computational model used to fit participants’ behavioural data from each task. The right column shows the free parameters that we fit to individual participants. The collection of these parameters constitutes the computational phenotype. b, Three potential sources of temporal variability: random noise, practice and state effects reflecting changes in mood and daily activities.

