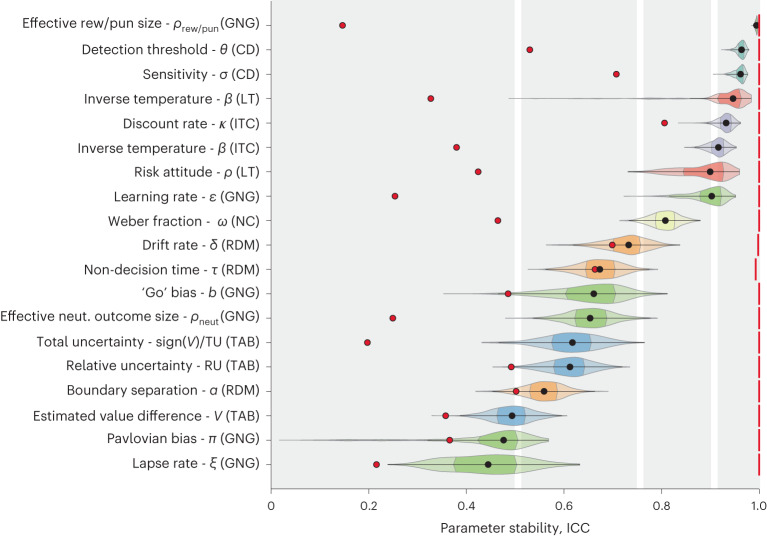
Fig. 2. Stability of the computational phenotype.
Violin plots show the bootstrapped stability estimates in terms of ICC for each parameter in the computational phenotype (1,000 bootstrap iterations over participants; violin colours indicate tasks). Black points mark the median, colour shaded areas mark the interquartile range (IQR). Red vertical lines mark the upper stability bound estimated using simulated data with a phenotype that is fixed in time. Red points mark the median ICC values estimated using the reduced statistical model, which does not account for the full hierarchical structure of the data. Note that most of the reduced model estimates fall within the area indicating poor reliability (see Supplementary Information for more details and discussion). Grey regions mark a common interpretation of ICC values35: <0.5 (poor), 0.5–0.75 (moderate), 0.75–0.9 (good) and >0.9 (excellent). ICC was calculated only in participants without missing sessions: Go/No-go (GNG): 53 participants out of 66 (53/66), Change detection (CD): 65/90, Intertemporal choice (ITC): 67/90, Lottery ticket (LT): 47/58, Numerosity comparison (NC): 69/90, Two-armed bandit (TAB): 66/90, Random dot motion (RDM): 73/90.

