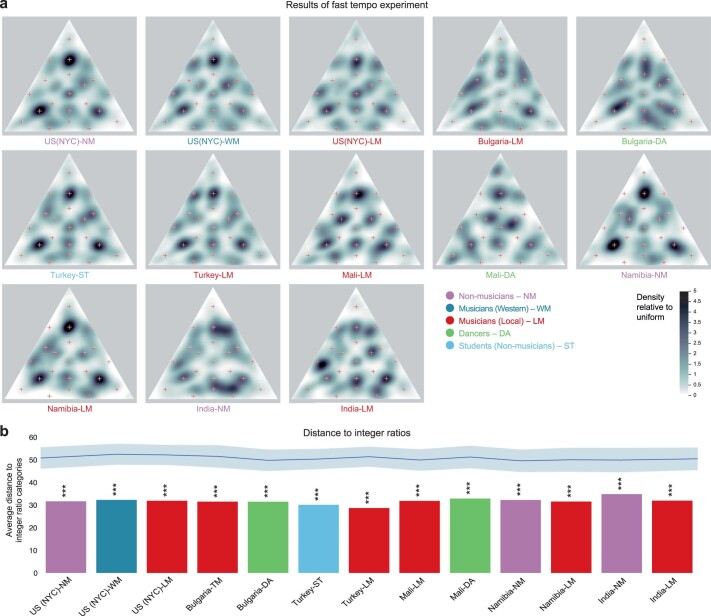
Extended Data Fig. 2. Results of the fast tempo experiment.
a, Estimated priors for the 13 groups that performed an additional version of the experiment with a faster stimulus tempo (overall pattern duration of 1000 ms compared with 2000 ms in the main experiment). b, Average distance from nearest integer ratio rhythm, for each participant group. This measure is small for a prior with all its mass at integer ratio rhythms. Shaded region at top plots mean and 95% confidence intervals of a null distribution of the average distance from randomly selected points. Asterisks mark statistical significance after Bonferroni correction for multiple comparisons (***: p<0.001). All groups have more probability mass concentrated closer to integer ratio rhythms than would be expected by chance.

