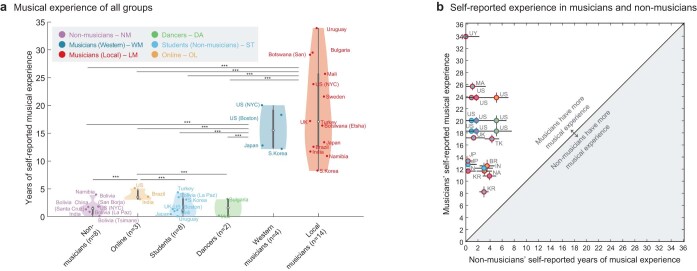
Extended Data Fig. 8. Musical experience in musicians and non-musicians.
a, Average self-reported years of musical experience for each participant group. Both traditional and Western musicians self-reported significantly more years of experience than other participant groups. In the violin plots, the open circle plots the median, and the top and bottom of the gray bar plot the 75th and 25th percentiles. We plotted significant comparisons with a threshold of p<0.001 (one-sided Wilcoxon test, corrected for multiple comparisons with Bonferroni correction). b, Scatter plot of self-reported years of musical experience for musician and non-musician groups from the same country. Each point represents a pair of non-musicians (x-axis) and musicians (y-axis) groups.

