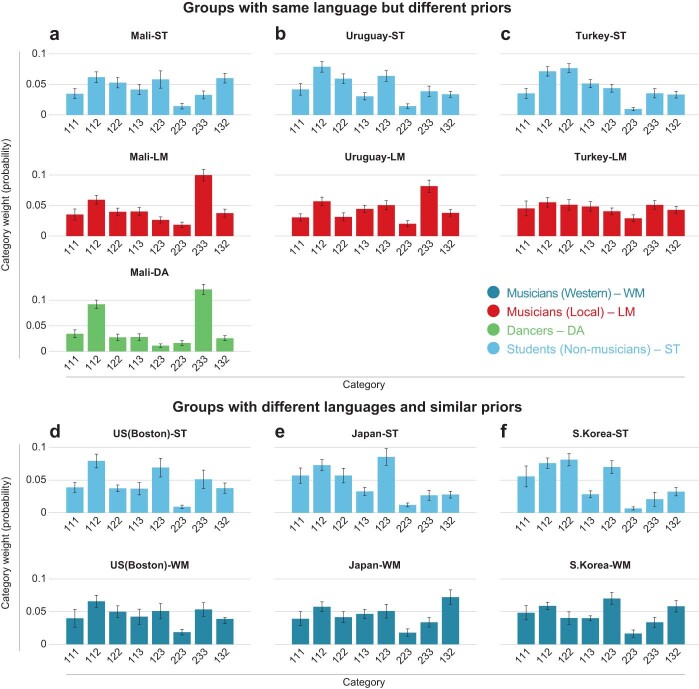
Extended Data Fig. 9. Comparison of rhythm priors in groups speaking different languages or with differing degrees of musical expertise.
a–c, Groups speaking the same language that exhibit different priors. Graphs plot weights of different rhythm categories in a Gaussian mixture model fit to the data of each group (see section on Gaussian mixture model fits in the Methods). Error bars plot standard deviation of the estimates derived from 1000 bootstrap samples (see methods). d–f, Groups speaking different languages that exhibit similar priors. The comparison of these groups also provides an example where priors can be similar between musicians and non-musicians if the music they consume is plausibly similar (compare the student non-musicians to the Western musicians). Same plotting conventions as in a-c.

