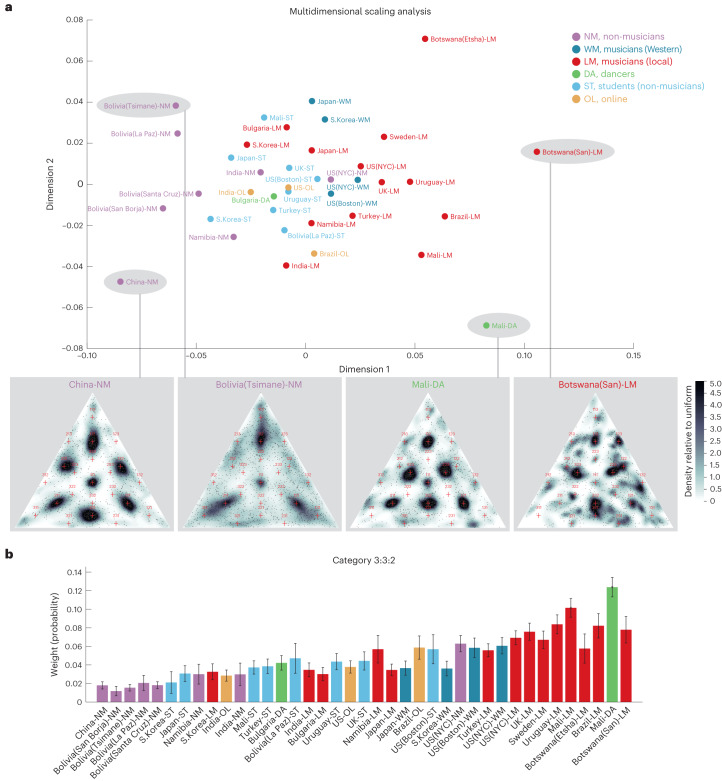
Fig. 5. Sources of cross-cultural variation in mental representations of rhythm.
a, Participant groups positioned in two dimensions via multidimensional scaling of their estimated rhythm priors. Group names are coloured to indicate musicians, dancers, non-musicians and university students. The insets show rhythm priors for the four participant groups lying at the corners of the multidimensional scaling space. These groups represent the extremes of the variation we observed. Note that for all analyses of specific rhythms, we averaged across the cyclic permutations of that rhythm (for example, 1:1:2, 1:2:1 and 2:1:1), as the differences between permutations were typically modest. See Extended Data Fig. 3 for an analysis of differences between cyclic permutations. b, Strength of the 3:3:2 rhythm (the average weight of the components at 3:3:2, 2:3:3 and 3:2:3 in the fitted Gaussian mixture model) for all participant groups, ordered according to their positions on the horizontal dimension of the multidimensional scaling space. This rhythm characterizes one dominant dimension of variation across groups. The error bars plot s.e.m., derived from 1,000 bootstrap samples.

