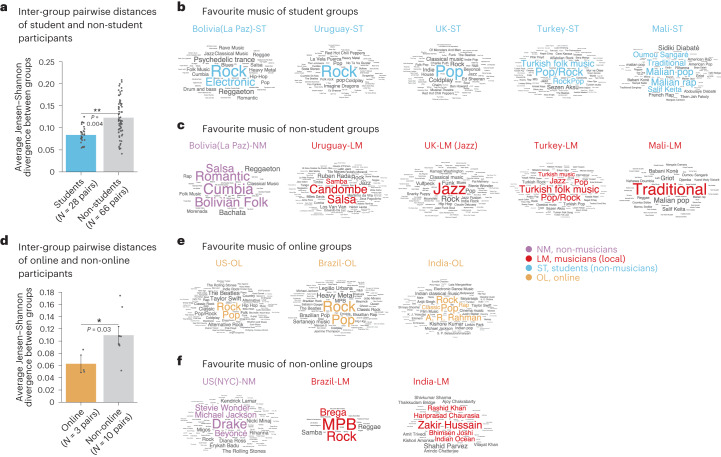
Fig. 6. Cross-cultural variation is reduced in university students and online participants.
a, Jensen–Shannon divergence between the estimated priors for pairs of student groups in different countries and pairs of non-student groups in the same set of countries (one for each student group). The error bars plot s.e.m., computed via bootstrapping. The dots indicate individual data points (to aid visualization, we added a small random offset to the horizontal position of each point). The asterisks mark one-sided statistical significance (**P < 0.01; *P < 0.05) computed via 10,000 bootstrap samples. b, Word clouds of favourite musical genres listed by student groups. c, Word clouds of favourite musical genres listed by non-student groups. d, Same as a, but for online and non-online groups. e,f, Same as b,c, but for online and non-online groups.

