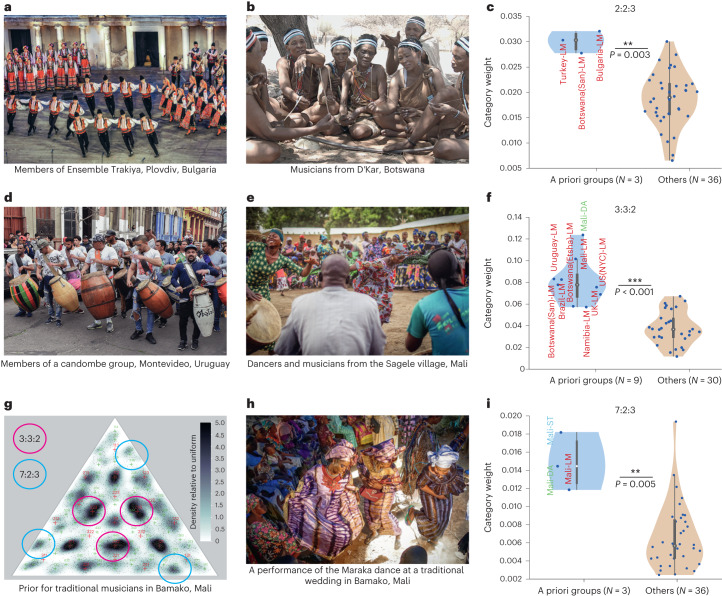
Fig. 7. Rhythm priors reflect established culture-specific musical features.
a, Dancers and musicians from Ensemble Trakiya in Plovdiv, Bulgaria. Here and in other panels, verbal informed consent was obtained from the groups in each photo. Credit: Ivan Banchev. b, Musicians from D’Kar, Botswana. Credit: Van K. Yang. c, Violin plots showing the strength of the 2:2:3 rhythm for all tested groups, separated into those in whose music the rhythm is prominent, and all other groups. Here and in other violin plots in this paper, the open circle plots the median, and the top and bottom of the grey bar plot the 75th and 25th percentiles. Whiskers (thin lines) are computed using Tukey’s method and reflect the range of non-outlier points (see 'Violin plots' for details). The violin plots are kernel density estimates of the data distribution. Here and in f,i, the asterisks mark statistical significance via one-sided Wilcoxon rank-sum tests (***P < 0.001; **P < 0.01; *P < 0.05). The 2:2:3 rhythm is strongly represented in the priors of traditional musicians in Bulgaria, Turkey and Botswana, when compared with all other groups. d, Members of a candombe group in Montevideo, Uruguay. e, Dancers and musicians from the Sagele village in Mali. f, The strength of the 3:3:2 rhythm for all tested groups, separated into those in whose music the rhythm is prominent (that is, the music of African and Afro-diasporic traditions), and all other groups. g, Rhythm prior for drummers from Bamako, Mali, showing modes at 3:3:2 and 7:2:3. h, A performance of the Maraka dance (featuring the 7:2:3 rhythm) at a traditional wedding in Bamako, Mali. i, Strength of the 7:2:3 rhythm for all tested groups.

