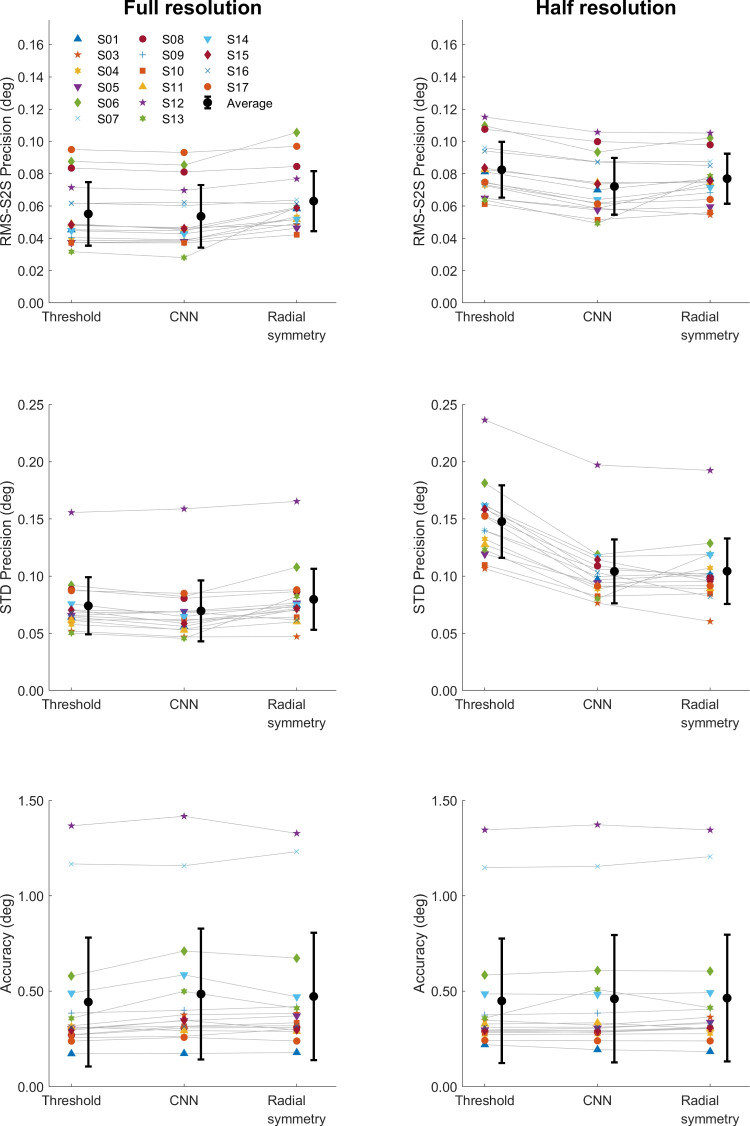
Fig. 10.
Data quality of calibrated gaze signals of dataset two. RMS-S2S precision (top panels), STD precision (middle panels) and accuracy (bottom panels) comparisons of the calibrated gaze signals derived from the three CR center localization methods is shown for all participants (colored symbols) along with the mean across participants (black circles) for analyses run both at full video resolution (left panels) and at half resolution (right panels). Error bars depict standard error of the mean

