Fig. 3.
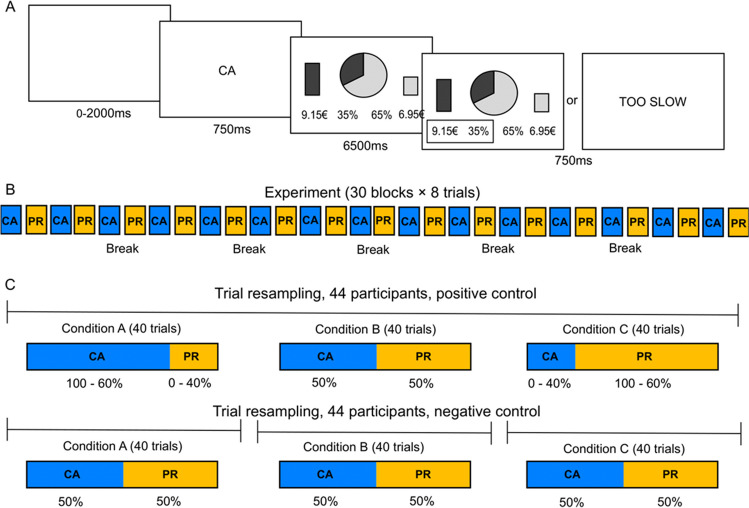
A Behavioral task. Successive screenshots displayed during a given trial are illustrated from left to right, with durations in milliseconds. On each trial, following a variable jitter (0–2000 ms) and a cue (750 ms), participants had to choose between a risky (left: 35% chance of winning or losing €9.15) and a safe (right: 65% chance of winning or losing €6.95) lottery. Choice durations are fixed (6500 ms), and followed by a choice-confirmation screen, where the selected lottery is highlighted by a contour box; or followed by a ”TOO SLOW” feedback if no lottery is selected (750 ms). Altogether, each trial is 10,000 ms long. B Experimental design. In total, participants performed 240 trials, spread over 30 blocks (i.e., 30 blocks of 8 trials), and they were provided with a short break every five blocks. Within each participant, CA and PR conditions were alternated between blocks; and between participants, the order of CA and PR conditions was counterbalanced. C Resampling approach in Scenario 1. For each participant (44 in total), 40 trials were resampled from the CA and PR conditions to form three new conditions A, B, and C. In the positive scenario, condition A contains a high proportion of CA trials (ranging from 100% to 60%) and a low proportion of PR trials (ranging from 0% to 40%); condition B, an equal number of CA and PR trials (50%); and condition C, a low proportion of CA trials (ranging from 0% to 40%) and a high proportion of PR trials (ranging from 100% to 60%). This mimics a mixture of processes under CA and PR conditions. In the negative scenario, condition A, B, and C contain an equal number of CA and PR trials (50%). This mimics the absence of a mixture of processes. To ensure that conditions A, B, and C differed in the negative scenario, in condition A, CA and PR trials were resampled from the beginning of the experiment (first 33% of the data); in condition B, from the middle (second 33% of the data); and in condition C, from the end (last 33% of the data)

