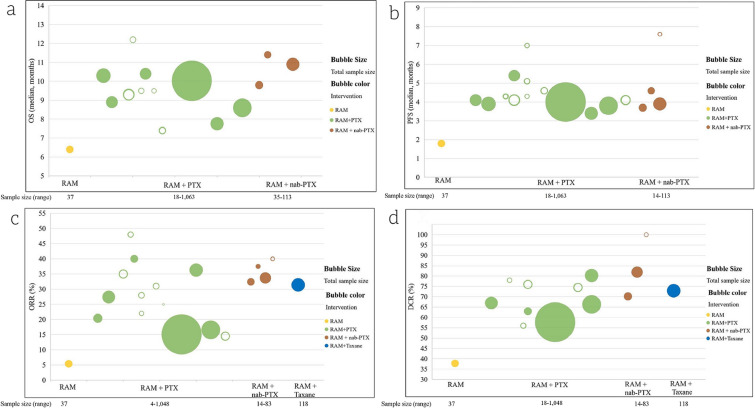
Fig. 3.
Bubble plots for the median OS (a), PFS (b), ORR (c), and DCR (d). (In the bubble plot, the total sample size of each study is represented by the bubble size. Solid bubbles represent full-text studies and hollow bubbles represent studies presented as conference abstracts. Different types of treatments are presented in the x-axis. Median survival or response rate for each study is presented in the y-axis. Results on subgroup populations with specific characteristics are not presented here.). OS overall survival, PFS progression-free survival, ORR objective response rate, DCR disease-free survival, RAM ramucirumab, PTX paclitaxel, nab-PTX albumin-bound paclitaxel

