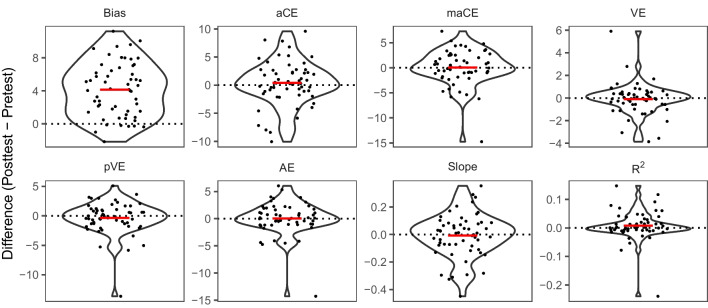
Fig. 5.
Changes in sound localization performance metrics after audiovisual exposure. Note. Performance changes in each metric were calculated by subtracting individual pretest from posttest values. Single-subject data points are superimposed on violin plots showing the distribution of individual difference values in each metric relative to the pretest baseline (indicated by the dotted lines). The group mean value is indicated by the red crossbars. The unit of measurement (y-axis) is in degrees azimuth except for slope and R2, which were taken from the regression model

