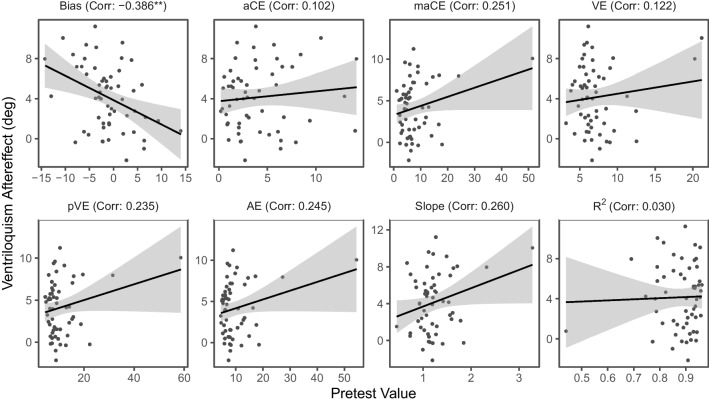
Fig. 6.
Correlations between pretest performance and size of the ventriloquism aftereffect. Note. The size of the ventriloquism aftereffect was calculated by subtracting pretest bias from posttest bias. Scatterplots show individual pretest values in each localization performance metric (x-axis) plotted against the ventriloquism aftereffect (y-axis) with regression lines. Corresponding Pearson correlation coefficients are indicated in the subplot titles. The unit of measurement is in degrees azimuth except for slope and R2, which were taken from the regression model. For pretest bias, negative values indicate leftward biases and positive values indicate rightward biases in localization. *p < .05. **p < .01. ***p < .001

