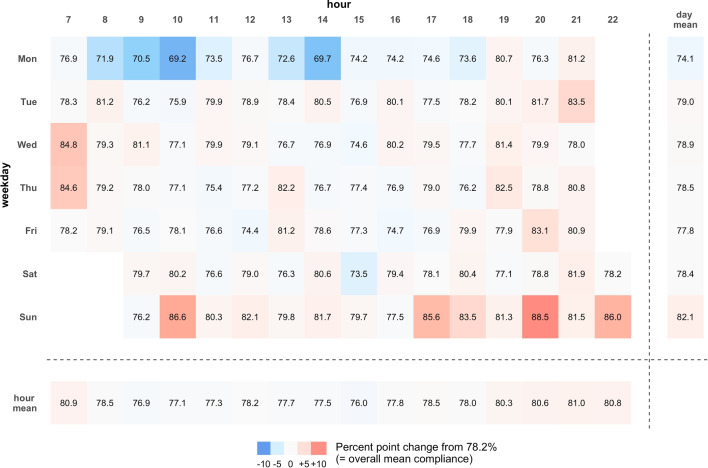
Fig. 2.
Deviation of beep level Compliance Rate from Overall Compliance Rate Depending on Weekday and Daytime. Note. Numbers in the grid cells represent the average compliance rate at the beep level across all participants for the respective weekday and daytime combinations. Daytimes of beeps ranged from 7 a.m./9 a.m. to 9 p.m./10 p.m. on weekdays and weekends, respectively. Right and bottom margin cells represent the beep level compliance rates averaged for the respective weekday and daytime. The degree of coloration represents the degree of deviation from the average overall compliance rate of 78.2%, with reds representing higher and blues representing lower compliance rates at the beep level

