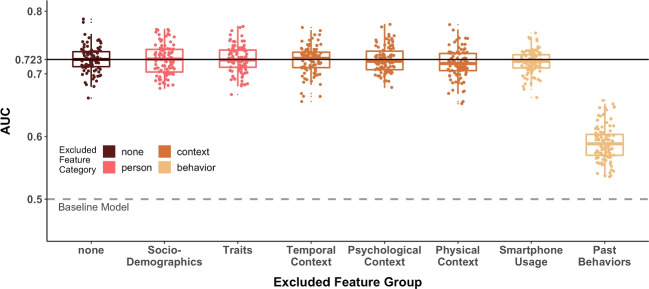
Fig. 4.
Prediction Performance of Elastic Net Models After Exclusion of Specific Feature Groups. Note. Distribution of the area under the operating characteristic curve (AUC) across the resampling iterations of the applied 10x10 CV scheme for the elastic net models after exclusion of each single subcategory. The boxplot in dark brown represents prediction performances with the initial full set of features (i.e., no exclusion of categories). For clarity, we include the median performance of this model as a solid black line. The remaining boxplots represent the performance (ordered and colored by feature subcategories) when one of the subcategories was excluded in each case. The gray dotted line at an AUC of .500 represents the prediction performance of the baseline model

