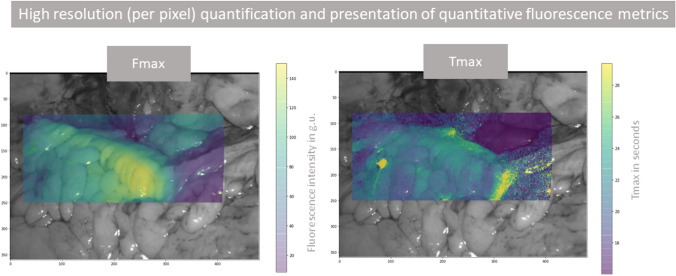
Fig. 3.
An illustrative high resolution (per pixel) quantification and presentation of quantitative fluorescence metrics (Fmax and Tmax) heatmap on the determinative ICGFA assessment of the descending colon for a left hemicolectomy for cancer. The legend on the left shows the colour scale for each plot (ranges vary by panel) with yellow being the highest value (brightest or slowest) and purple being the least (darkest or slowest). The axes denote co-ordinates on the screen. These metrics do not take into consideration the reference angiogram

