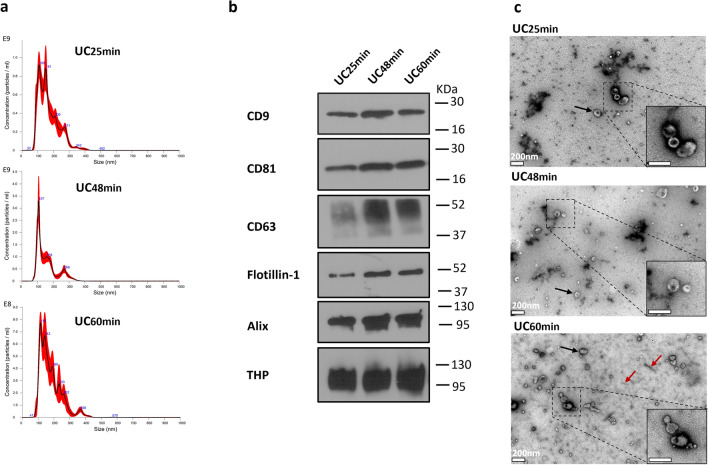
Figure 2.
Characterization of small EVs (SEVs) isolated from 25 min (UC25min), 48 min (UC48min) and 60 min (UC60min) ultracentrifugation. (a) Nanoparticle tracking analysis (NTA) graphs display in y-axis: concentration (Particle/mL), and in x-axis: size (nm). (b) Western-blot (WB) for CD9, CD81, CD63, Flotillin-1, Alix and THP on SEVs samples. Western-blot images were cropped; the original blots are presented in Fig. S7 from Supplementary Material S2. (c) Transmission electron microscopy (TEM) analysis, in which black and red arrows correspond to SEVs and THP polymer (defined as the typical structure usually observed for THP protein), respectively. White bar represents a 200 nm scale. NTA and WB techniques were performed in 3 urine samples (only one sample is represented), and TEM in one sample.

