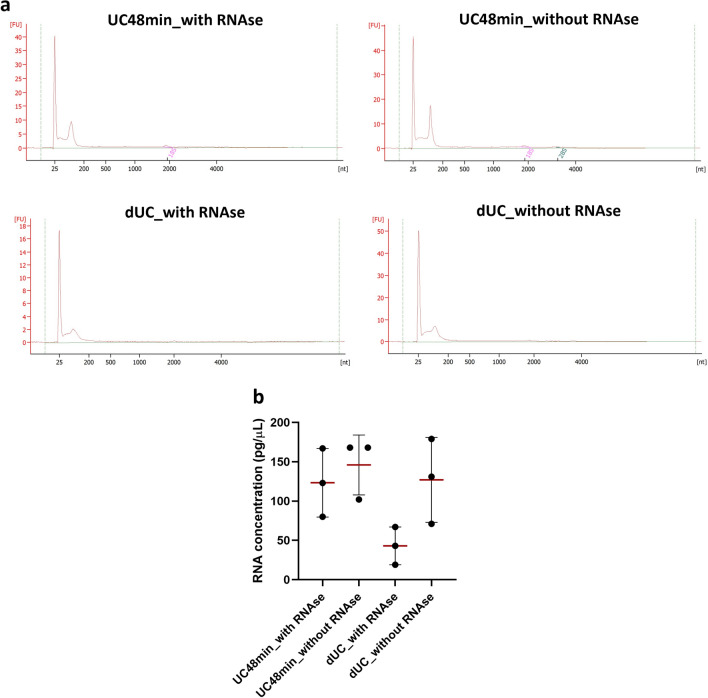
Figure 6.
Bioanalyzer graphics representing RNA size distribution of UC48min and dUC in RNAse treated and non-treated samples and dot plots with standard deviation from RNA concentration. (a) Bioanalyzer graphs: y-axis corresponds to fluorescence units (FU) and x-axis to the number of nucleotides (nt). (b) Horizontal red lines correspond to the means of RNA concentration of tested samples. Comparisons were made in 3 independent urine samples.

