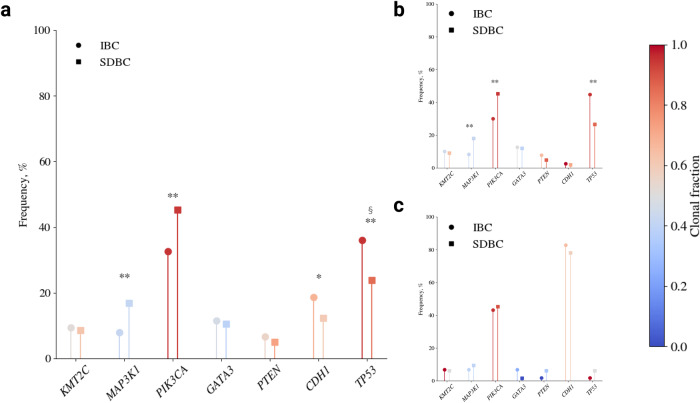
Fig. 3. Frequency and clonality of driver gene mutations in IBC and SDBC.
The mutational frequency of driver genes for: a all IBCs and SDBCs; b ductal IBCs and SDBCs (c) lobular IBCs and SDBCs. The colour scale corresponds to the total fraction of detected mutations that are clonal, with a fraction of 1 indicating that every detected mutation is clonal and a fraction of 0 indicating that every detected mutation is subclonal. The clonal fraction is defined as Nclonal/(Nclonal+Nsubclonal), where N is the number of detected mutations in the gene across the cohort. ** significant difference in mutational frequency imposing a Bonferroni adjusted P-value of 7.46 ×10⁻⁴, * a significant difference at an unadjusted P-value of 0.05. § a significant difference in clonal fraction at an unadjusted P-value of 0.05.

