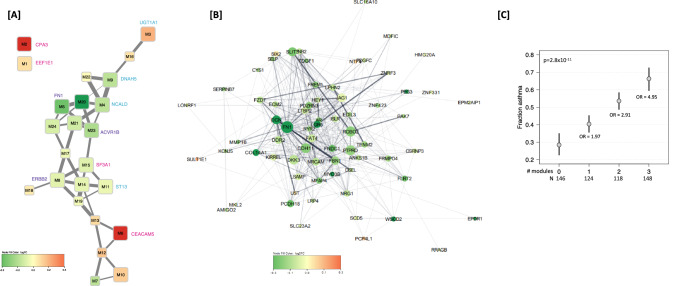
Fig. 2. Differential module expression based on the N = 1326 DEGs with FDR < 0.15 for active asthma.
Panel A Module connectivity network for the 24 modules. Each node represents a module, and each edge represents a significant positive Pearson pairwise correlation of module expression (correlation >0.5). Node color intensity corresponds to log2FC in DE Module analysis for asthma (red upregulated in cases, green downregulated in cases). Differentially expressed modules are larger in size (q < 0.05). Edge weight indicates correlation (wider edges higher correlation of module expression). Panel B STRING network retrieved for genes assigned to module M5 with hub gene FN1. Each node represents a gene and each edge represents a protein-protein interaction with a stringdb score >0.15. Node color intensity corresponds to log2FC in DE analysis of asthma (red upregulated in cases, green downregulated in cases). Node size was made proportional to the number of interactions of the node divided by maximum number of interactions of a node in the gene module (dg/max dg of module). Unconnected nodes were not included. Edge weight and transparency indicate stringdb score (wider, darker edges indicate higher score). Panel C Fraction of asthma cases and ORs for asthma if an individual was in the upper median for any one, any two and all three modules (M4, M5, M6). Fitted probabilities (gray dots) and 95% confidence intervals (black lines) were derived from a logistic model with number of modules as an additive predictor. Source data are provided as a Source Data file.

