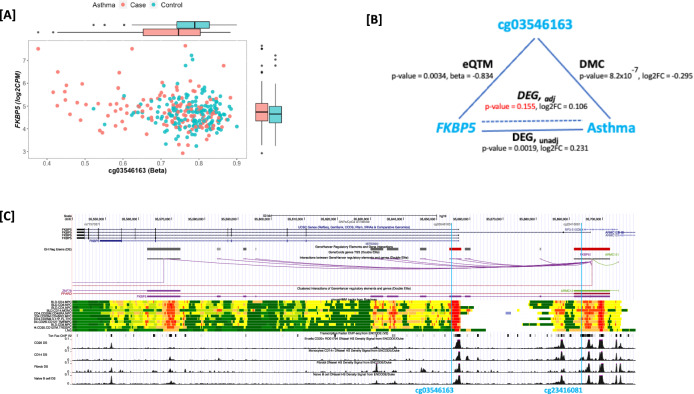
Fig. 3. Epigenetic mechanism relating gene expression to asthma for FKBP5.
Panel A Scatter plot of methylation (beta) values at cg03546163 vs gene expression (log2 CPM) values for FKBP5 and box plots showing median, lower and upper quartiles, whiskers extending to the furthest data point no more than 1.5 times the distance between the lower and upper quartiles, and outliers, by asthma case and control status for N = 298 individuals. Panel B Effect sizes and unadjusted p-values from two-sided multivariate linear regression models for DMC analysis (cg03546163 and asthma, N = 331), eQTM analysis (cg03546163 and FKBP5 expression, N = 298) and DEG (FKBP5 expression and asthma, N = 298) analysis pre- and post-adjustment for methylation at the CpG (labeled DEG, unadj and DEG, adj). Panel C UCSC Genome Browser view of the FKBP5 locus, indicating locations of cg03546163 (pcHiC) and cg23416081 (5 kb of TSS) showing interaction between the GeneHancer regulatory elements at these two regions. Publicly available data from tracks displayed includes location of exonic and intronic gene regions from the UCSC gene annotation; regulatory elements, genes and their interactions from GeneHancer, in detailed and clustered views; chromHMM tracks from Roadmap; transcription factor CHIP-seq from ENCODE; and DNAse hypersensitivity density signal from ENCODE for CD20 + B-cells, CD14+ monocytes, fibroblasts and naïve B-cells. Source data are provided as a Source Data file.

