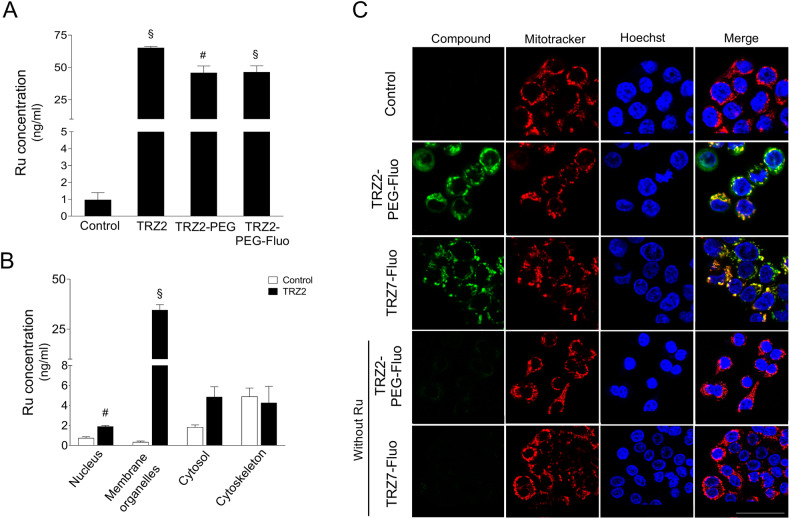
Fig. 2. Ru-TRZ hybrids enter HT29 cancer cells and accumulate preferentially in mitochondria.
Ruthenium (Ru) concentration was determined by ICP-MS in (A) whole-cell lysates and (B) subcellular fractions nucleus, membrane organelles, cytosol, and cytoskeleton isolated from HT29 cells exposed to 5 µM of indicated Ru-TRZ compounds or DMSO (vehicle control), for 24 h. C Representative confocal images of HT29 cells exposed to 1 µM of indicated fluorescently-tagged Ru-TRZ hybrids (green) or DMSO (vehicle), for 15 min, and stained with mitotracker (red). Nuclei were counterstained with Hoechst 33342 (blue). Scale bar, 25 µm. Results are expressed as Ru concentration (ng/ml) for the mean ± SEM of three independent experiments. Statistical analysis was performed using Student’s t-test and comparing Ru-TRZ-exposed cells with controls. #p < 0.05 and §p < 0.001 from control cells.

