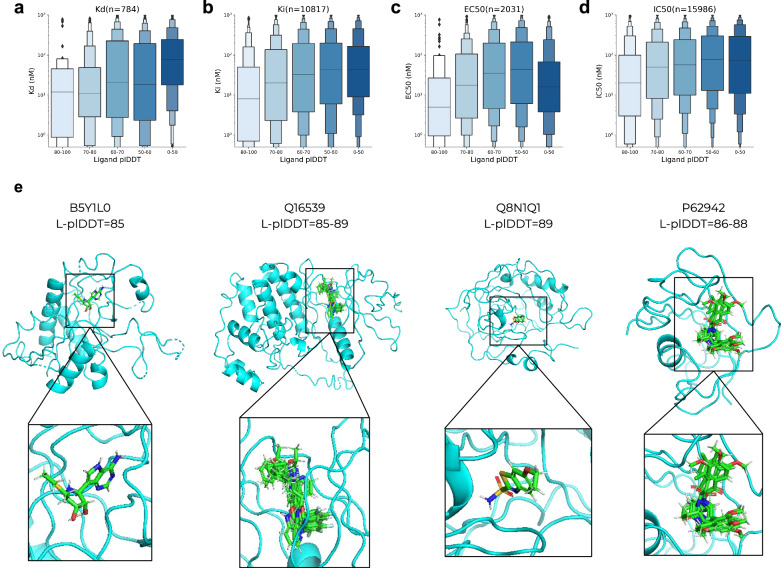
Fig. 4. BindingDB predictions.
a–d Affinity (log scale) KD, Ki, EC50 and IC50, respectively vs average Umol ligand plDDT binned in steps of 10 (no pocket information, n = 27810). The centre boxes encompass data quartiles and horizontal lines mark the medians for each distribution with min/max values marked by diamonds. All experimental measures show a relationship with the ligand plDDT suggesting that the network can distinguish strong from weak binders. We also calculate the p-values between the affinity distributions using a selection of plDDT <50 or >80. The Corresponding p-values (one-sided t-test associating having a higher affinity value with a lower plDDT) are 1.58e-17, 5.45e-18, 0.0052 and 0.059 for Kd, Ki, EC50 and IC50 data, respectively (a–d). e Examples of predicted protein-ligand complexes from BindingDB. The UniProt IDs and the range of ligand plDDT (L-plDDT) scores are displayed above the structures. We note that even though these structures seem plausible and their L-plDDT scores are high, they remain to be experimentally verified.

