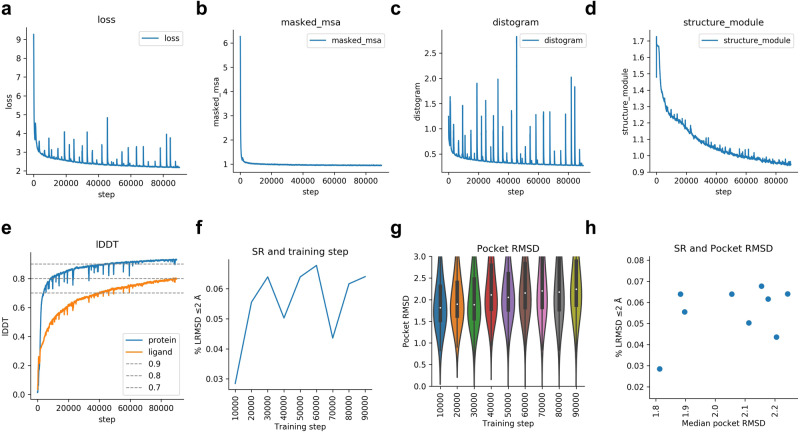
Fig. 7. Training curves and metrics for Umol.
a The combined loss function (Eq. 1) vs the training step. b Masked MSA loss vs training step. c Distance loss vs training step. d Structure module loss vs training step. This is the combination of FAPE and AUX (Eq. 1) e lDDT for protein and ligand vs training step. The protein accuracy is higher than that of the ligand. f Success rate (SR, % of protein-ligand complexes predicted with ligand RMSD ≤ 2 Å) for the validation set (n = 741 protein-ligand complexes) at checkpoint intervals of 10000 steps. The examples that failed (n = 104) did so due to RAM limitations and missing interface atoms. The SR is 2.8, 5.6, 6.4, 5.0, 6.4, 6.8, 4.4, 6.2 and 6.4 for steps 10000-90000, respectively. g RMSD of the atoms in the protein pocket for the validation set (n = 741 protein-ligand complexes) at checkpoint intervals of 10000 steps. The examples that failed (n = 104) did so due to RAM limitations and missing interface atoms. Boxes encompass data quartiles, horizontal lines mark the medians and upper and lower whiskers indicate respectively maximum and minimum values for each distribution. h Median pocket RMSD vs SR for the validation set (n = 741 protein-ligand complexes) at the different checkpoints. The examples that failed (n = 104) did so due to RAM limitations and missing interface atoms.

