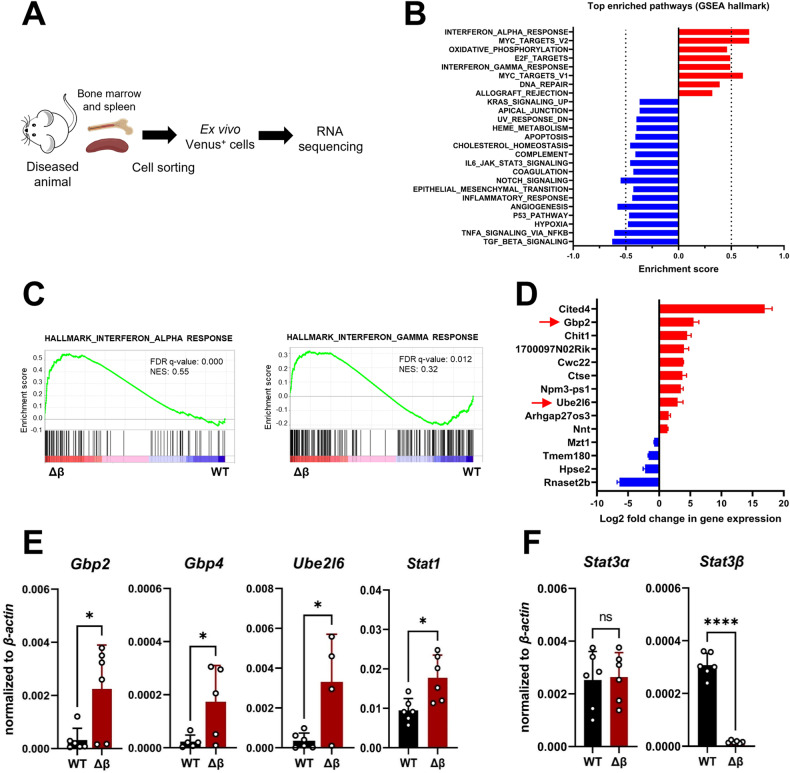
Fig. 4. Gene expression analysis reveals enrichment of IFN-regulated genes in blasts lacking STAT3β isolated from diseased animals.
A Sample preparation for RNA sequencing (n = 3 per group and organ). For sorting strategy see Supplementary Fig. 4B. B Top enriched pathways (nominal p < 1%) in blasts lacking STAT3β. C GSEA plots of WT and STAT3β-deficient blasts isolated from SP of diseased animals (FDR False discovery rate, NES normalized enrichment score). D Significant hits shared between BM- and SP-derived blasts (n = 6). E RT-qPCR of ex vivo samples (n = 6, pooled BM and SP). F RT-qPCR on Stat3 isoform expression in ex vivo samples from BM and SP (n = 6, pooled). Statistical analysis was performed using Student’s t test and indicated as p ≤ 0.05:*, ≤0.01:**, ≤0.001:*** and ≤0.0001:****. Error bars represent means ± SD.

