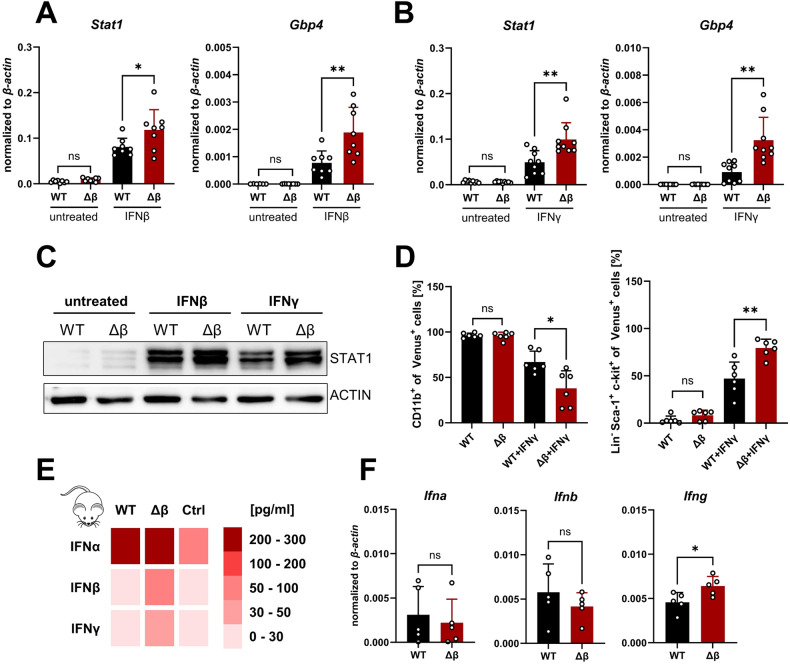
Fig. 5. STAT3β deficiency increases IFN responsiveness.
A mRNA expression after 3 h 100 U/ml IFNβ stimulation (n = 8, 3 independent experiments, 2–3 cell lines). B mRNA expression after 3 h 100 ng/ml IFNγ stimulation (n = 9, 3 independent experiments, 3 cell lines). C Western blot after 24 h IFN treatment. D Flow cytometry quantification of CD11b+ and Sca-1+ cells after 48 h IFNγ treatment (n = 6, 3 independent experiments, 2 cell lines). E Heatmap represents the average concentration measured in the plasma of diseased animals via multiplex assay. (n = 5 per group, 3 controls). F mRNA expression of Ifna, Ifnb, and Ifng in leukemia cells after 7 days in methylcellulose analyzed via RT-qPCR (n = 5, 3 independent experiments, 2 cell lines). Statistical analysis was performed using Student’s t test and indicated as p ≤ 0.05:*, ≤0.01:**. Error bars represent means ± SD.

