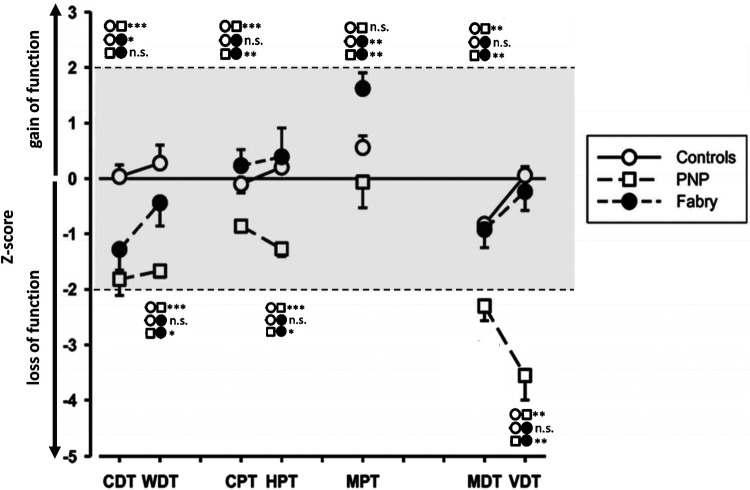
Figure 2.
Quantitative sensory testing (QST) profiles of controls and PNP and FD patients. The asterisks indicate significant group differences; *** ≙ p < 0.001; ** ≙ p < 0.01; * ≙ p < 0.05; group symbols are indicated on the right side of the figure. FD patients exhibit a loss of Aδ-function, while the PNP group exhibits a wide range of dysfunction with functional loss of small and large fibers. The controls are within the normative range of Z-values. CDT, cold detection threshold; WDT, warm detection threshold; CPT, cold pain threshold; HPT, heat pain threshold; MPT, mechanical pain threshold; MDT, mechanical detection threshold; VDT, vibration detection threshold; FD, Fabry disease; PNP, polyneuropathy.

