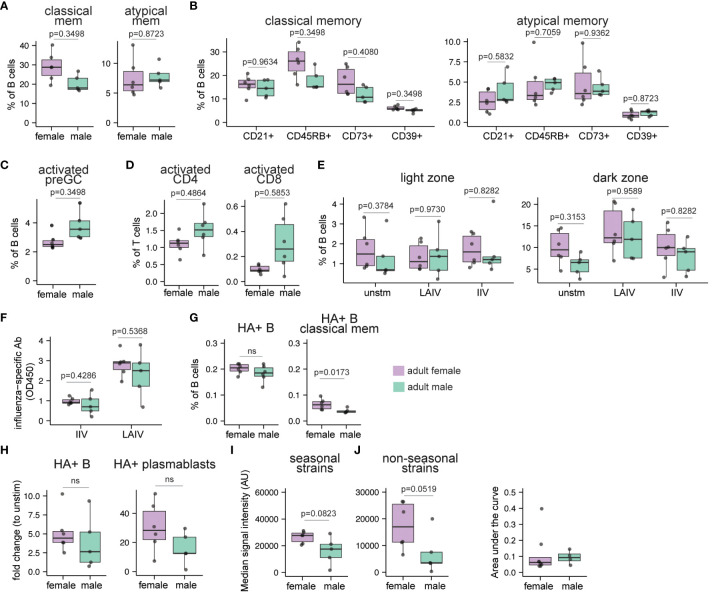
Figure 5.
Sex bias in immune cell composition and immune responses to influenza antigens in human tonsil organoids derived from adults. Tonsil samples and influenza antigen stimulated tonsil organoids from age-matched adult males and females (n=11, 5 males, 6 females) were assessed by flow cytometry to evaluate immune cell composition ex vivo and immune response to influenza antigens on day 10. (A) cell frequencies of classical memory (CD38- CD27+) and atypical memory (CD27- IgD-) B cells in the ex vivo tonsil tissues. The phenotypes of (B) classical memory and atypical memory B cells and (C) activated (CD83+) preGC B cells in the ex vivo tonsil tissues. (D) Frequencies of activated (HLA-DR+ CD38+) CD4 and CD8 T cells. (E) The frequencies of CD83+ light zone and CXCR4+ dark zone GC B cells in tonsil organoids on day 10. (F) Influenza-specific antibody secretion from IIV and LAIV-stimulated tonsil organoids. (G) Frequencies of A/California/2009 H1N1 HA-specific B cells and classical memory B cells in ex vivo tonsil tissues. (H) Fold change in A/California/2009 H1N1 HA-specific B cells and plasmablasts (within total B cells) in LAIV-stimulated tonsil organoids compared to unstimulated organoids. (I) Median signal intensities (arbitrary units) for influenza-specific IgG (HA and non-HA) elicited by LAIV in the tonsil organoids on day 10 for all the seasonal and non-seasonal influenza virus subtypes. (J) The area under the curve (AUC) for neutralizing antibodies for A/California/07/2009 H1N1 virus present in the culture supernatants in the LAIV-stimulated tonsil organoids derived from adult males and females on day 14 (n=12, 8 females, 4 males). A lower AUC indicates enhanced virus neutralization. Each point represents one donor. Mann Whitney U tests followed by multiple hypothesis correction (using the Benjamini & Hochberg method) were used to calculate p values (A-E). Mann Whitney U tests were used to calculate p values between groups (F–I). Boxplots indicate the median value, with hinges denoting the first and third quartiles and whiskers denoting the highest and lowest value within 1.5 times the interquartile range of the hinges.

