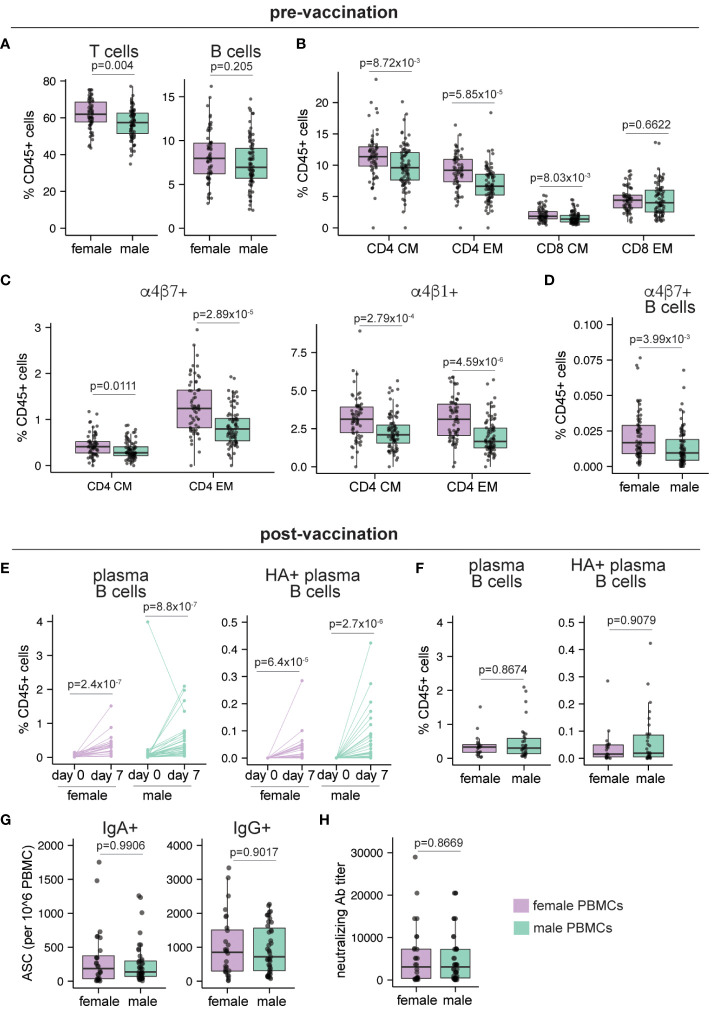
Figure 6.
Sex differences in human peripheral blood pre- and post-vaccination. Peripheral blood samples were collected from adult healthy volunteers on day 0 (pre-vaccination, n=149; 65 female, 84 male) and day 7 post IIV vaccination (n=56; 33 male, 23 female). Mass cytometry was used to characterize the immune cells as described in McIlwain et al. Frequencies of (A) B and T cells, (B) central memory (CM) and effector memory (EM) CD4 and CD8 T cells, (C) gut homing (α4β7+) and lymphoid homing (α4β1+) CD4 CM and EM T cells, (D) gut homing non-plasma B cells before vaccination. (E) Frequencies of plasma B cells and A/California/2009 H1N1 HA-specific plasma B cells before and 7 days after vaccination. (F) Frequencies of plasma B cells and A/California/2009 H1N1 HA-specific plasma B cells in female and male donors on day 7 post-vaccination. (G) Number of IgA+ and IgG+ antibody secreting cells (ASCs) enumerated by ELISPOT on day 30 post-vaccination (n=71; 28 female, 43 male). (H) Neutralizing antibody titers for A/California/2009 H1N1 virus on day 30 post-vaccination (n=71; 28 female, 43 male). Each point represents one donor. Mann Whitney U tests were used to calculate p values. Additionally, multiple hypothesis correction (using the Benjamini & Hochberg method) was performed for data in (A–D, F) Significance levels are shown for FDR < 0.1. Boxplots indicate the median value, with hinges denoting the first and third quartiles and whiskers denoting the highest and lowest value within 1.5 times the interquartile range of the hinges.

