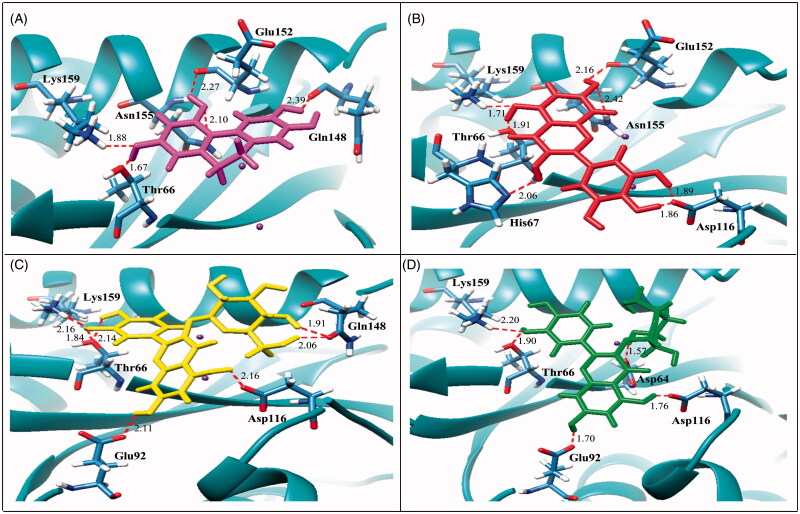
Figure 2.
Molecular docking of active compounds with HIV-1 IN. The ribbon models show the backbone of HIV-1 IN catalytic domain with all hydrogen bonding residues are shown as stick models and coloured by heteroatom. Hydrogen bond interactions are shown as red dash lines and represent bond length in angstrom (Å). Mg2+ ions are shown as purple balls. Compound 3 (A), compound 4 (B), compound 6 (C), and compound 7 (D).

