
Figure 3.
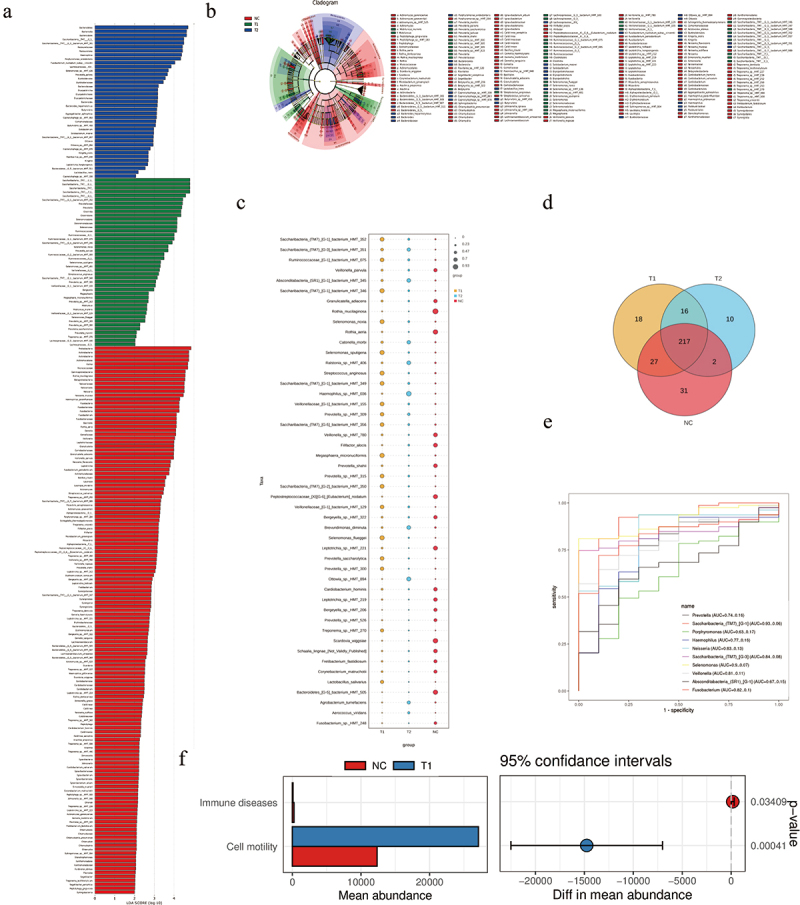
(a-b-c) LEfSe comparison, cladogram, and bubble plot between initially inoperable patients with LAESCC before chemoradiotherapy (T1), post chemoradiotherapy group (T2), and healthy controls (NC). (d)The Venn plot of indicative biomarkers in patients’ groups and control. (e)The result of ROC curve analysis showing a significant high AUC value for cancer diagnosis. (f) The microbiome functions of patients and control were predicted by PICRUSt2 analysis with Welch’s T test.