FIG. 2.
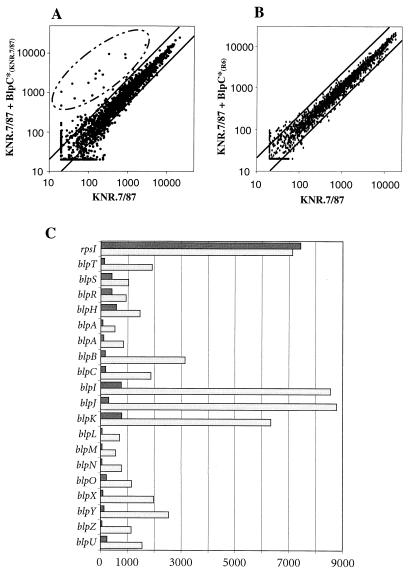
Genes specifically induced by BlpC*. (A) Strain KNR.7/87 was grown to an optical density at 600 nm of 0.3, and the synthetic peptide BlpC*KNR.7/87 was added to a final concentration of 250 ng/ml to half of the culture. Cell pellets were collected after 30 min, RNA was extracted, and cDNA was labeled and hybridized to the microarray as described in Materials and Methods. The scatter graph shows the correlation for the intensities of all transcripts obtained for KNR.7/87 (x axis) versus KNR.7/87 30 min after addition of BlpC*KNR.7/87 (y axis). These values are the average of two independent experiments. The two solid lines flanking the diagonal indicate a difference of a factor of 2. Relevant changes involved 16 genes (circled). Due to the frameshift in blpA sequenced from strain KNR.7/87, this gene is represented by two independent probe sets on the microarray. (B) Same intensity scatter graph with KNR.7/87 after addition of BlpC*R6. KNR.7/87 (x axis) versus KNR.7/87 30 min after addition of BlpC*R6 (y axis). No genes were found to be differentially expressed. (C) Bar graph showing the normalized average intensity differences for a selection of genes in KNR.7/87 (dark bars) and KNR.7/87 30 min after addition of BlpC*KNR.7/87 (light bars). Genes are sorted as they appear on the contigs as depicted in Fig. 1. All 16 genes of the blp regulon plus the TCS operon (blpSRH) and a control ribosomal protein gene (rpsI) are shown (blpA again represented twice as two independent probe sets). The y axis shows average intensity differences calculated as described in Materials and Methods and is representative of the relative transcript abundance.

