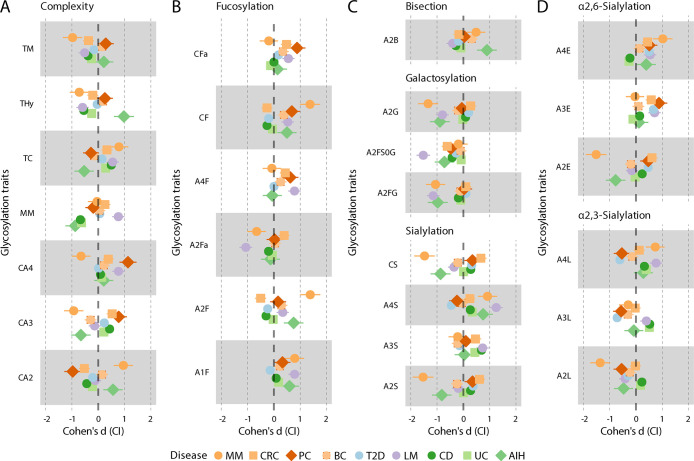
Figure 4.
Forest plots visually illustrating the effect sizes of glycosylation traits observed in the presented studies. The glycosylation traits are grouped based on their structural characteristics. Each horizontal line in the plot represents a different study. Point estimates along these lines show Cohen’s d values–representing the effect size or the magnitude of the differences in glycosylation traits between the case and control groups. Lines extending from these points denote the 95% confidence intervals (CI). Cohen’s d was specifically selected for its capacity to standardize effect sizes across studies, effectively neutralizing the impact of sample size variations. To ensure consistency and comparability across different cohorts, a standardized methodology was applied to recalculate the glycosylation traits. Further details about the specific glycosylation traits and their compositions are available on Figure 1C and in Table S2. Abbreviations in the figure: MM – multiple myeloma,41 CRC – colorectal cancer,45 PC – pancreatic cancer,35 BC – breast cancer,46 T2D – type 2 diabetes,37 LM – leishmaniasis,33 CD – Crohn’s disease,38 UC – ulcerative colitis,38 AIH – autoimmune hepatitis.47 Colors indicate disease categories (orange-red: cancer; blue: metabolic disease; purple: infectious disease; green: autoimmune or inflammatory disease). Shapes were intended to aid visual interpretability. Note that IBD presented on Figure 2 as one category, is divided into the two subcategories CD and UC here.

