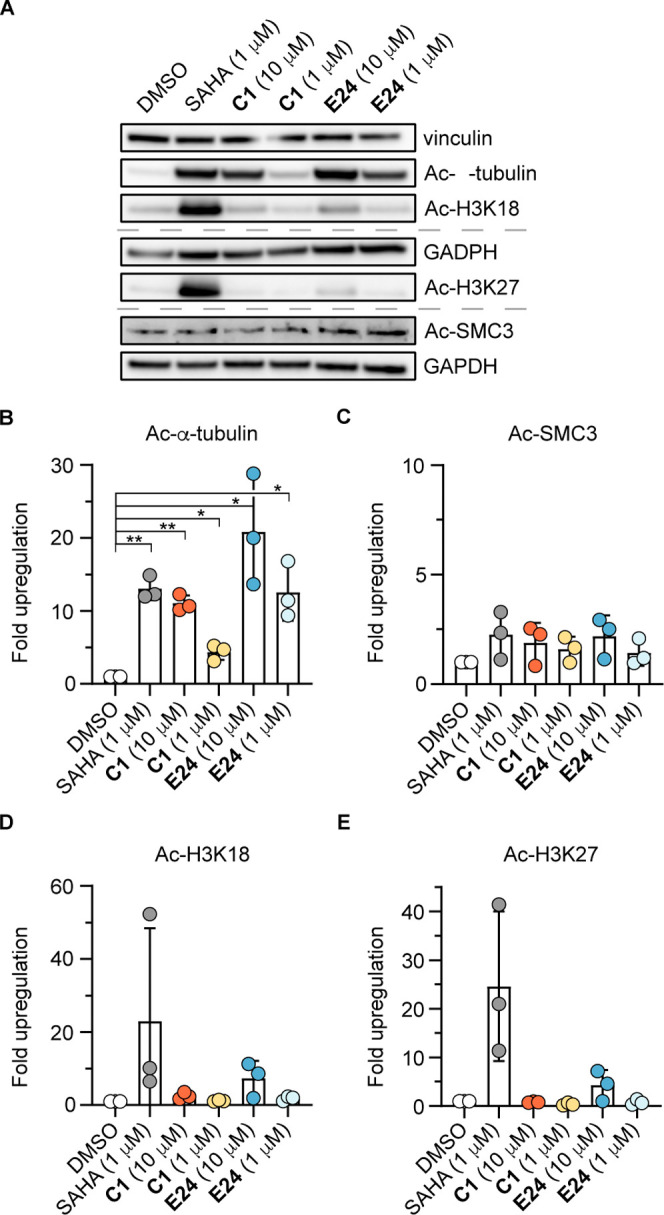
Figure 3.

Inhibition of HDACs in cells. (A) Representative Western blots of lysine acetylation (α-tubulin, H3K18, H3K27, and SMC3) upon 5 h treatment with compounds C1 or E24 (1 or 10 μM), SAHA (1 μM), or DMSO. (B–E) Quantification of acetylation, normalized to vinculin or GAPDH loading control, and relative to DMSO (data represent mean ± SD, n = 3 biologically independent samples). See Supporting Figure S14 for full blots and replicates.
