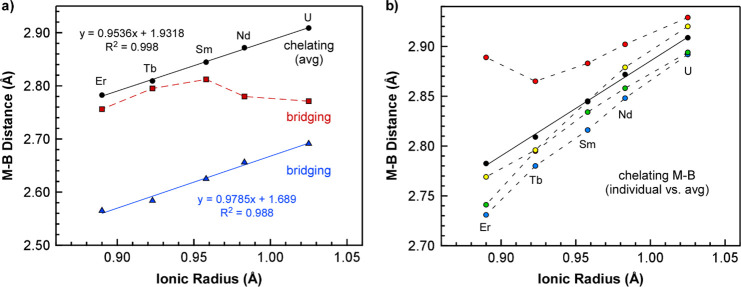
Figure 2.
(a) Plot of chelating (average) and bridging M–B distances obtained from single-crystal XRD studies of M(H3BPiPr2BH3)3 (M-iPr) complexes vs ionic radius of the corresponding metal (CN = 6).22 The distances associated with the bridging iPr-PDB ligands are denoted by red squares and blue triangles, and average distances associated with the chelating iPr-PDB ligands are represented by black circles. (b) Plot of all chelating M–B distances (colored circles) and average chelating M–B distances (black circles) vs ionic radius of the metal. Solid lines in both plots represent linear fits, whereas dashed lines are included to help guide the eye between data points.

