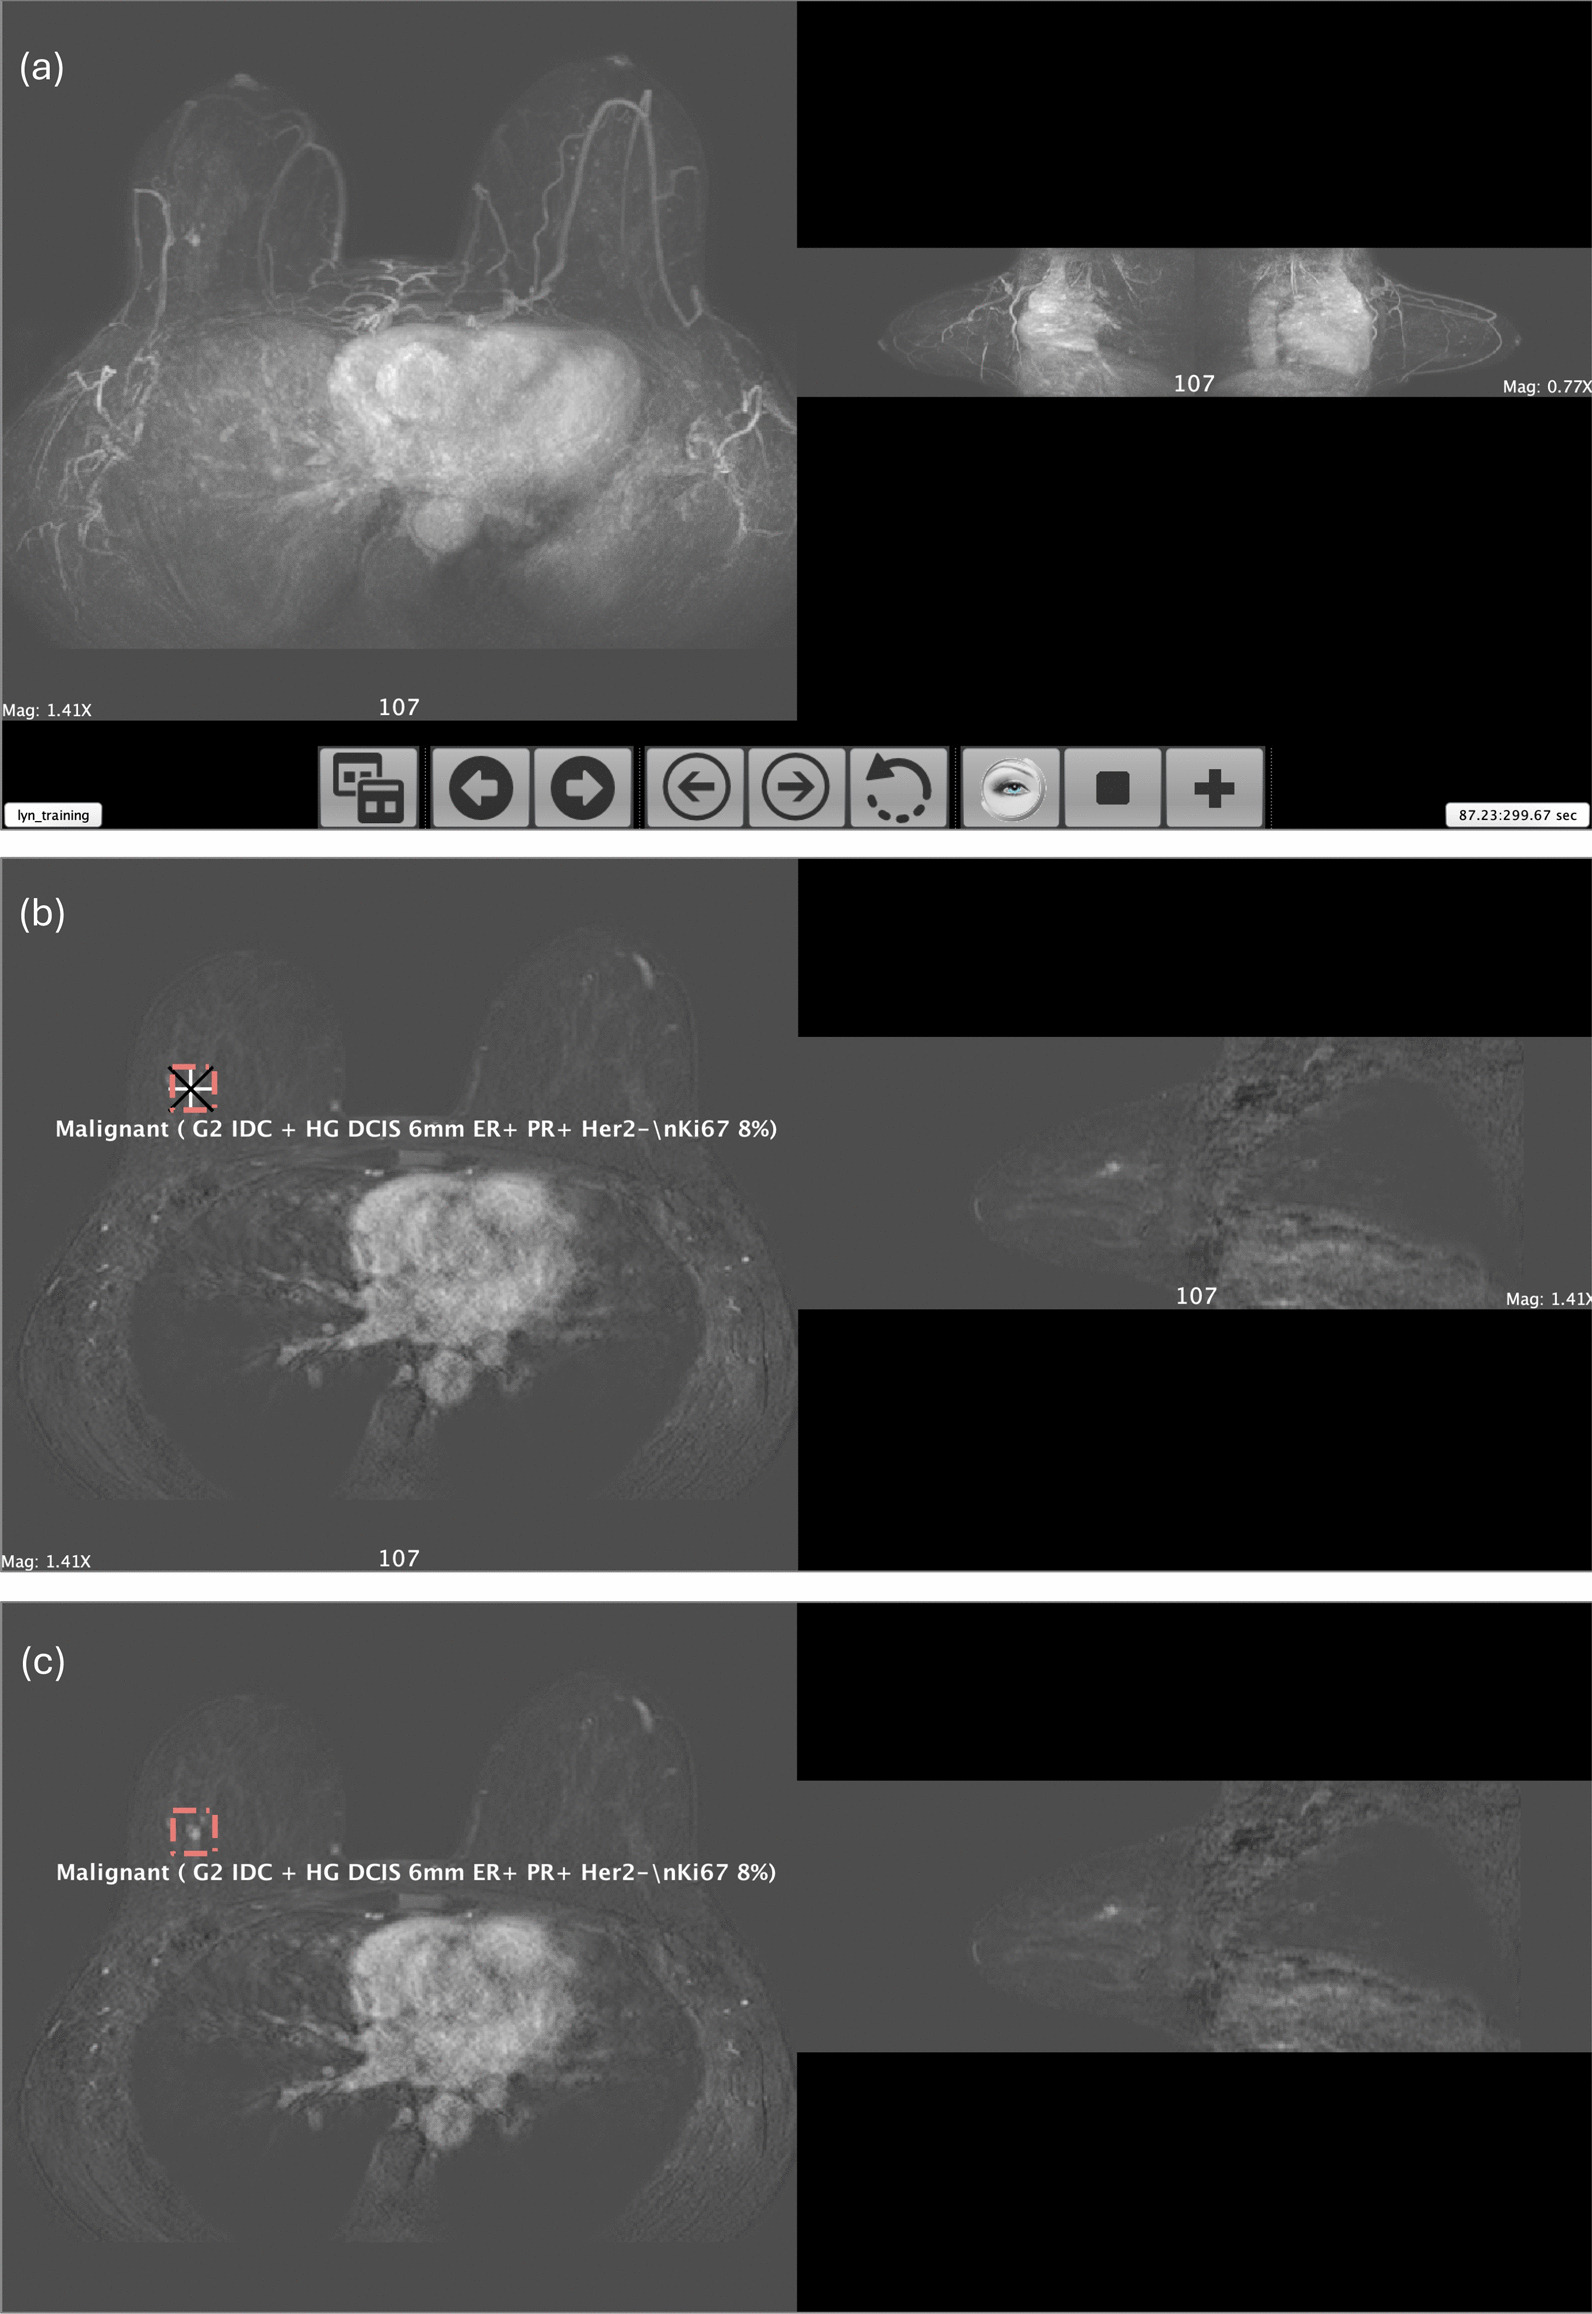
Fig. 1.

RiViewer software display of an example cancer case from the test set a Maximum intensity projections (MIP). The whole RiViewer screen is shown, including the control panel and timer. b Axial and sagittal slices as they would appear to a reader who has correctly identified a cancer and committed to their opinion for the case. The ground truth is displayed as a red, volume region of interest (ROI) and the reader’s point ROI is displayed as white and black superimposed crosses. Pop-up white text describes the ground truth/cancer histology. c Axial and sagittal slices with the reader’s point ROI hidden to enable the reader to review the cancer appearance prior to moving on to view the next scan. This figure demonstrates how the software enabled trainee readers to compare their own opinion with the ground truth of each scan during formative assessment in the current study
