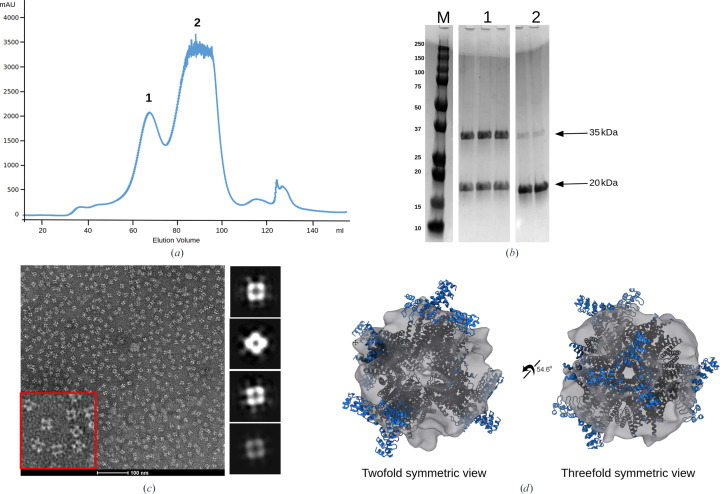
Figure 2.
Validation of scaffold assembly. (a) The size-exclusion profile shows a peak corresponding to an assembled scaffold (peak 1) and is able to be separated from the unassembled or partially assembled cage components (peak 2). (b) SDS–PAGE analysis of the peak fractions shows the presence of both scaffold components at their correct molecular weights, denoted by black arrows. (c) Higher order assembly was verified by negative-stain electron microscopy identifying particles of the proper size and symmetry. An enlarged view of the micrograph (red box) shows particles with an estimated diameter of approximately 19 nm, matching the dimensions of the X-ray structure of the DARP3 scaffold (Fig. 3 ▸; PDB entry 8v9o). The particles had a tendency for a preferred orientation along the twofold viewing axis. To the right of the micrograph are rough 2D averages processed from negative-stain data. (d) 2D classes were used to generate coarse ab initio 3D models.

