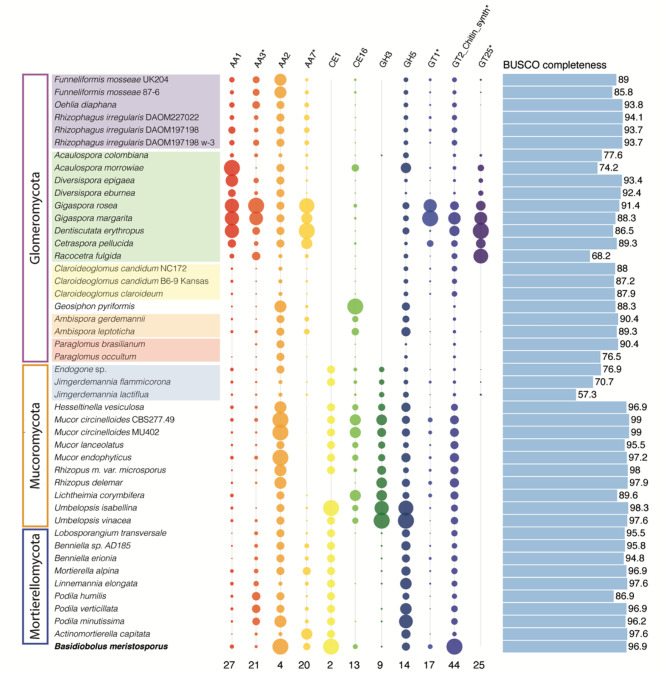
Fig. 2.
Gene copy numbers across eleven CAZyme gene families, six representing PCWDEs detected across the analyzed phyla (AA1, AA2, CE1, CE16, GH3 and GH5, Table S4) and five selected because of expansions in Gigasporaceae, here indicated with * (AA3, AA7, GT1, GT2 Chitin synthetase and GT25). Circle sizes are proportional to the number of genes annotated in each assembly, scaled individually for each gene family for readability with the maximum number of genes indicated at the bottom of each column. Estimated BUSCO completeness (Table S2) of the analyzed genome assemblies is indicated by bars to the right. Species are organized according to the phylogenetic tree in Fig. 1 and Endogonales as well as orders in Glomeromycota are highlighted by colored boxes, each color correspond to different taxonomic families

