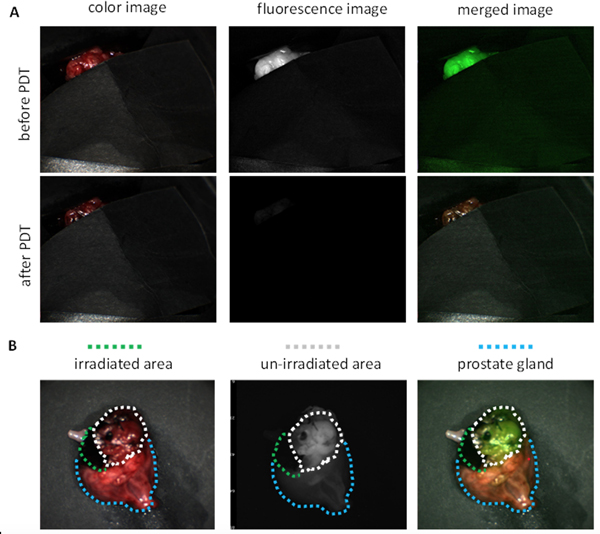
Figure 3.

Representative fluorescence images of PDT treatment for prostate tumor (Dog #3). A. In vivo FL image of prostate tumor before PDT and after PDT treatment, with most of the tumor and majority of the prostate gland covered. B. Ex vivo FL image of whole prostate after PDT (all cover removed; White circles indicates non-irradiated tumor area, green circles indicates irradiated area and blue circles indicates normal prostate gland.)
