
FIGURE 2.
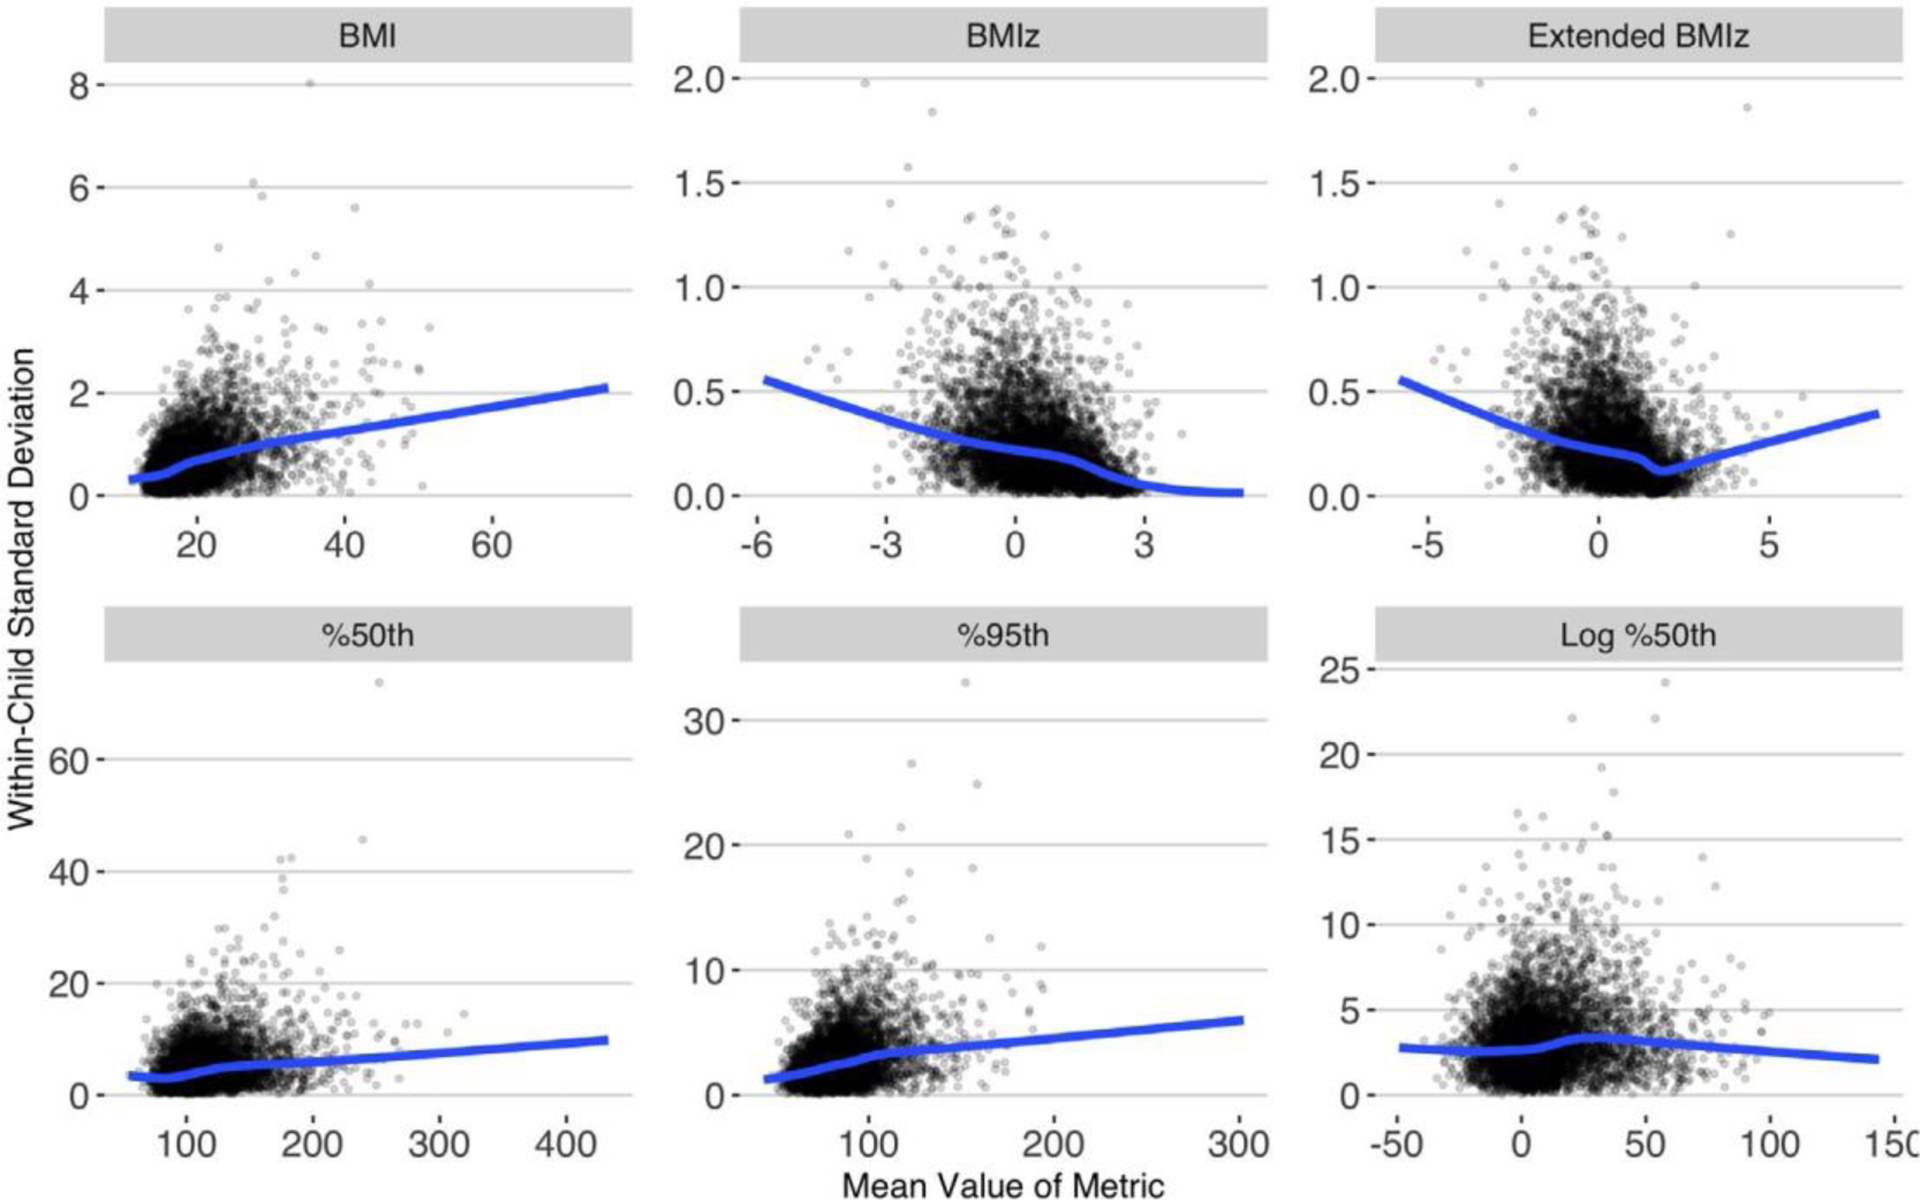
Smoothed relation, for each BMI metric, of each child’s mean value to the within-child SD. The smoothed, blue lines were estimated with lowess using data from all 285 643 children. The points represent 5000 randomly selected children
Official websites use .gov
A
.gov website belongs to an official
government organization in the United States.
Secure .gov websites use HTTPS
A lock (
) or https:// means you've safely
connected to the .gov website. Share sensitive
information only on official, secure websites.
Smoothed relation, for each BMI metric, of each child’s mean value to the within-child SD. The smoothed, blue lines were estimated with lowess using data from all 285 643 children. The points represent 5000 randomly selected children