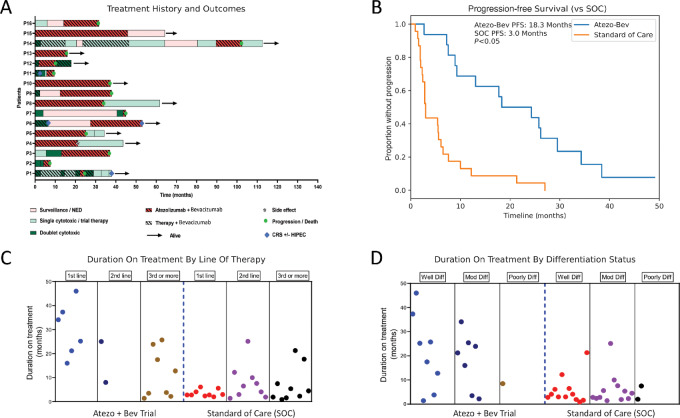
FIGURE 2.
Comparison to synthetic cohort and stratification. A, Swimmers plot demonstrating time on treatment for all therapies patient received. B, PFS plot demonstrating combination of Atezo-Bev versus median prior SOC treatments 18.3 months (95% CI: 8.9–29.5) versus 3 months (95% CI: 3.1–8.7). C, Duration of treatment stratified by line of therapy comparing Atezo-Bev with duration on SOC treatments patients received prior to study enrollment. D, Duration of treatment stratified by differentiation status comparing Atezo-Bev with duration on SOC treatments patients received prior to study enrollment.

