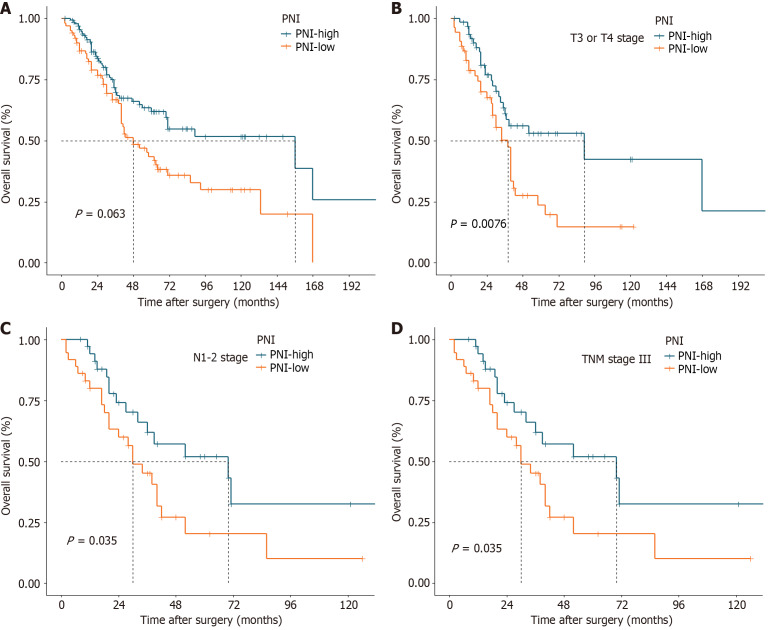
Figure 1.
Comparison of the overall survival curves of different groups divided by the prognostic nutritional index. A: For all patients. The 5-year overall survival rates were 61.8% and 43.4% in the prognostic nutritional index (PNI)-high group and PNI-low group, respectively (P = 0.006); B: For patients with stage T3 or T4 disease (P = 0.001); C: For patients with lymph node metastasis (stage N1-3, P = 0.035); D: For patients with stage TNM III disease (P = 0.035). PNI: Prognostic nutritional index.

