Figure 2.

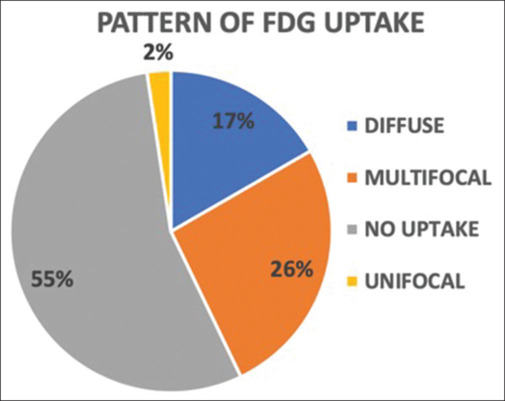
Pie chart showing percentage of different patterns of fluoro-2-deoxy-D-glucose uptake on positron emission tomography/computed tomography. FDG: Fluoro-2-deoxy-D-glucose

Pie chart showing percentage of different patterns of fluoro-2-deoxy-D-glucose uptake on positron emission tomography/computed tomography. FDG: Fluoro-2-deoxy-D-glucose