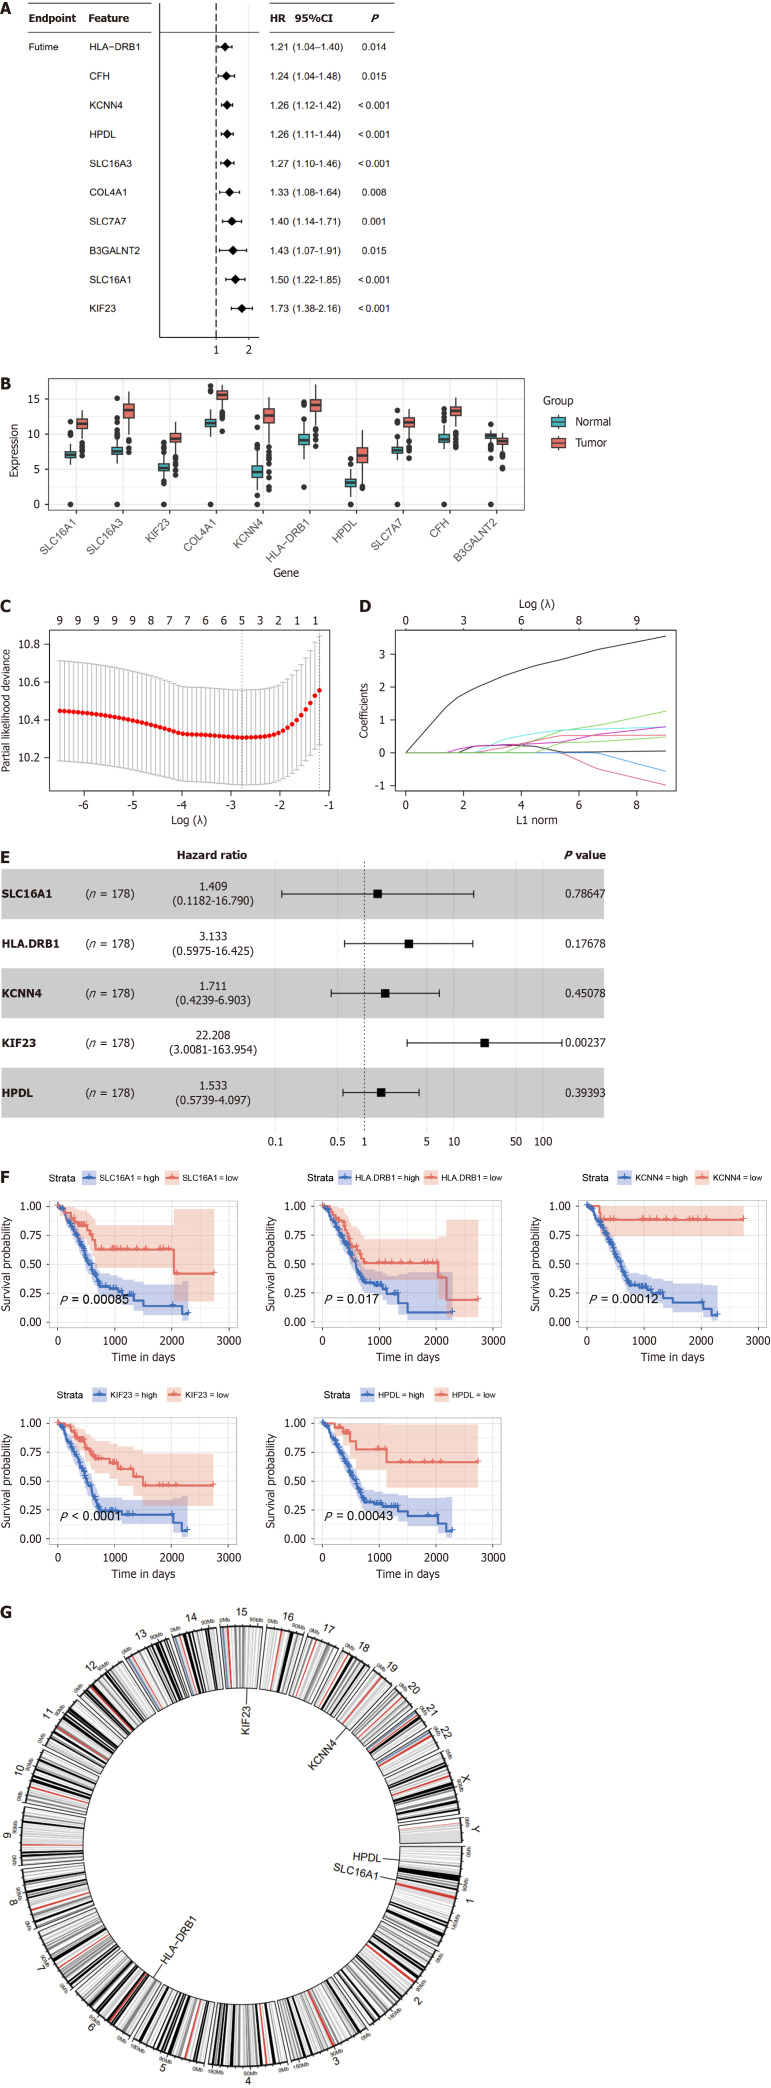
Figure 2.
Construction of the lactylation-related prognostic model. A: Univariate Cox regression analysis screened 10 prognostic lactylation-related genes (LRGs); B: Expression difference of LRGs between normal and pancreatic ductal adenocarcinoma tissues; C and D: Lasso regression analyses of LRGs using the overall survival (OS) model; E: Multivariate Cox regression analysis of LRGs was shown using a forest plot; F: The OS curve of the prognostic LRGs; G: Circle plot of the location of the five LRGs. HR: Hazard ratio.

