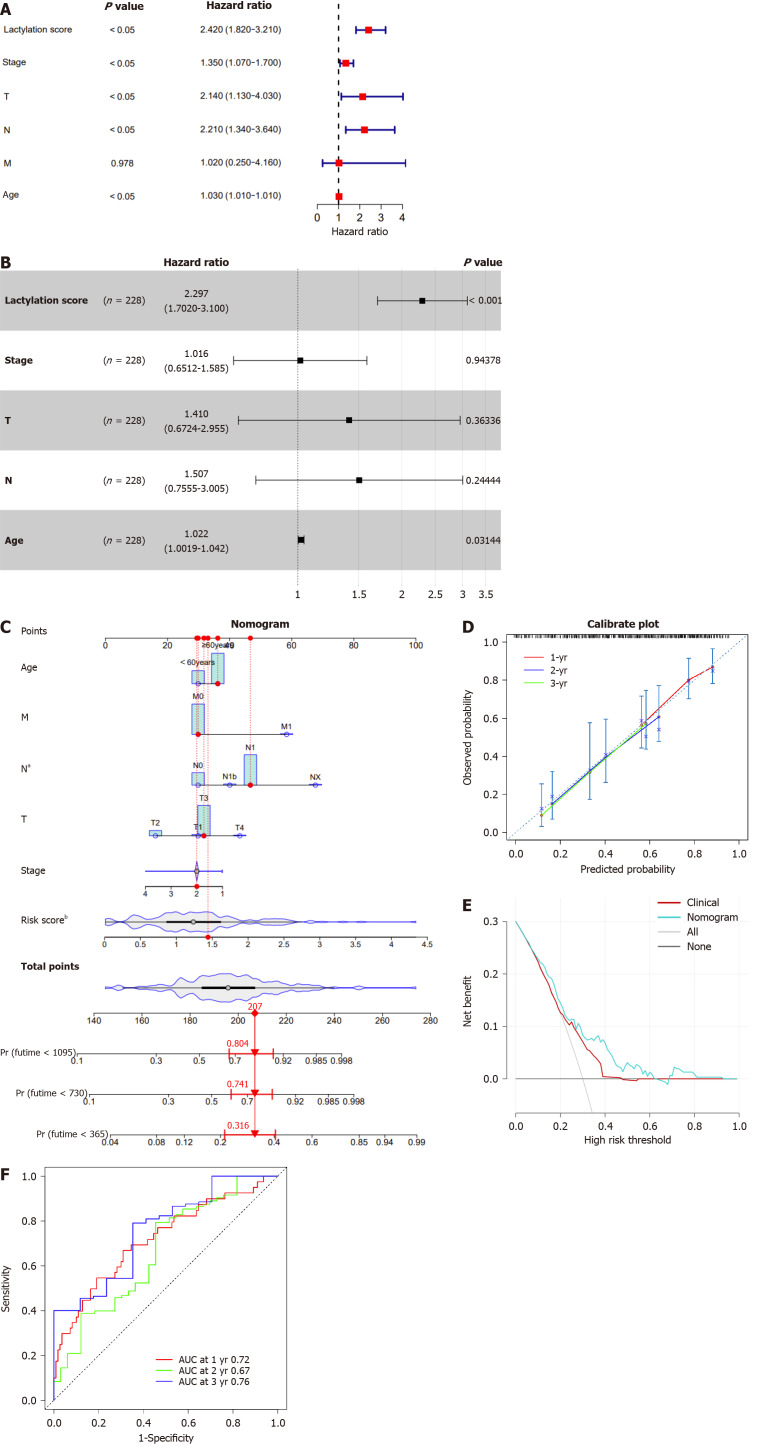
Figure 5.
Construction and evaluation of the nomogram. A and B: The univariate and multivariate Cox regression analyses in patients with pancreatic ductal adenocarcinoma (PDAC); C: The nomogram by combining lactylation score with age for predicting the 1-,3-, and 5-year survival probability of patients with PDAC; D: The calibration curves of the nomogram for predicting overall survival (OS) probability for 1-, 3-, and 5-years OS probabilities; E: Decision curve analysis of the nomogram; F: Receiver operating characteristic analysis of the nomogram. aP < 0.05, bP < 0.01. AUC: The area under curve.

